A project aimed to create a predictive classifciation model to identify the appropriate users for the upcoming campaign.
Authors: Jesslyn Jane, Aditya Ridwan, Ann Sinaga, Lhutfia Ichsan, Mustiadi Zakki, M. Triargi. This is a project I have worked through as part of the final capstone in Rakamin Academy: Data Science Bootcamp.
Github | Google Colab | PPT | All Processes
Introduction
PT Halcyon is a company operating in the marketing industry as a marketing consultant company. The company is known to have an acceptance rate for marketing campaigns of around 14.91%, which is still considered low by management in facing business competition.
Therefore, the management has requested the marketing team to further increase the acceptance rate for marketing campaigns so that the costs incurred by the company in conducting marketing campaigns are more efficient and the amount of revenue they achieve in the following years increases.
Hence, the marketing team plans to implement Targeted Marketing strategy with the assistance of the data science team to process historical sales data that they have previously compiled and group users into specific categories according to their respective characteristics, so that they can distinguish between those who are eligible for the campaign and those who are not eligible for the campaign.
Goal
Increase the response rate to the company’s campaigns can lead to higher profits for the company.
Objective
Create a predictive classification model system that can determine the appropriate target users. This will certainly increase the value of predefined business metrics such as traffic and sales performance. The system will identify which users are genuinely interested or part of the target market for the upcoming campaign.
Business Metrics
- Response rate
- Revenue rate
Exploratory Data Analysis (EDA)
Descriptive Analysis
The dataset consists of 28 features and 1 target variable, which is Response (the ratio of the number of customers who respond compared to the total impressions of the campaign).
Univariate Analysis
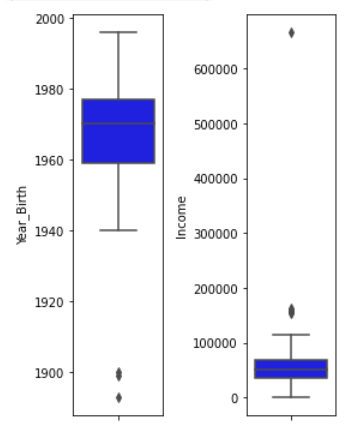
Using a boxplot, outliers were found in the features Year_Birth and Income.
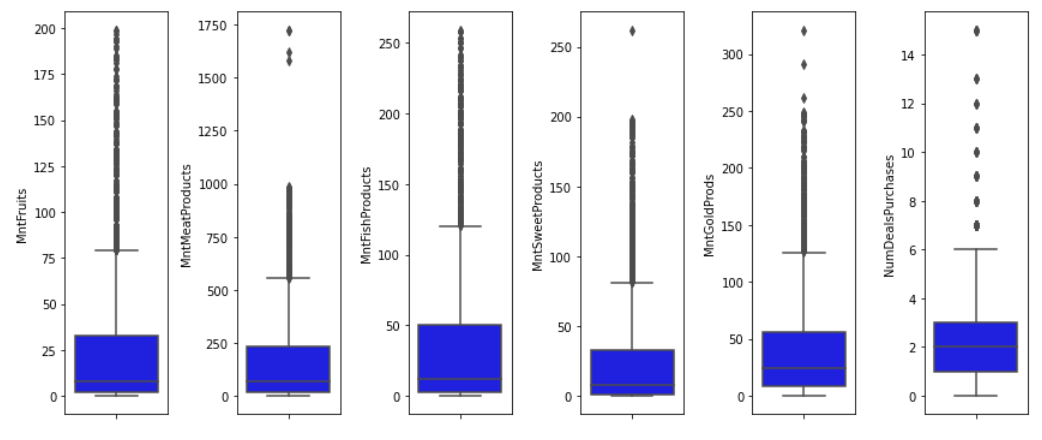
Additionally, outliers were also found in the features related to purchases of goods (‘MntWines’, ‘MntFruits’, ‘MntMeatProducts’, ‘MntFishProducts’, ‘MntSweetProducts’, ‘MntGoldProds’).
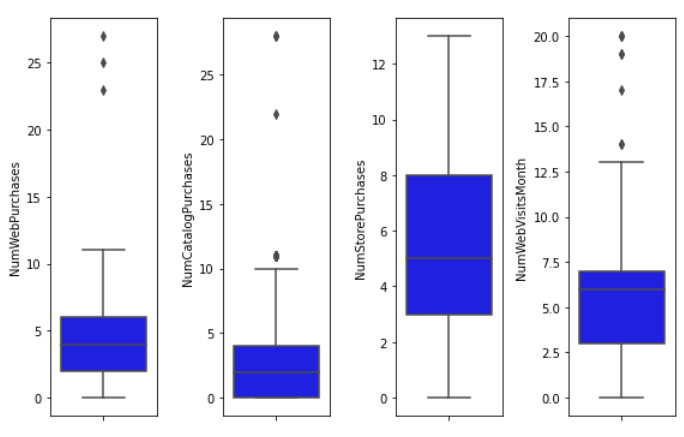
Similarly, outliers were also identified in the features related to purchases (‘NumWebPurchases’, ‘NumCatalogPurchases’, ‘NumStorePurchases’, ‘NumWebVisitsMonth’).
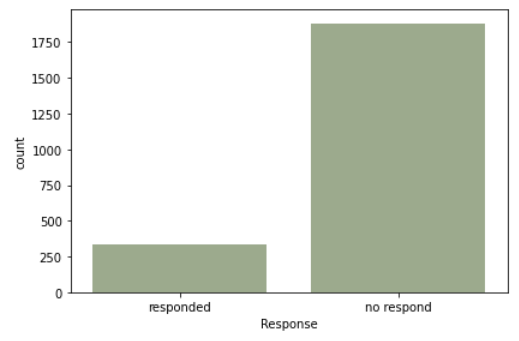
In the category plot, an interesting insight was found regarding the response feature, indicating an imbalance between customers who responded and those who did not respond. This suggests the presence of class imbalance, necessitating over/undersampling during the pre-processing stage.
Multivariate Analysis
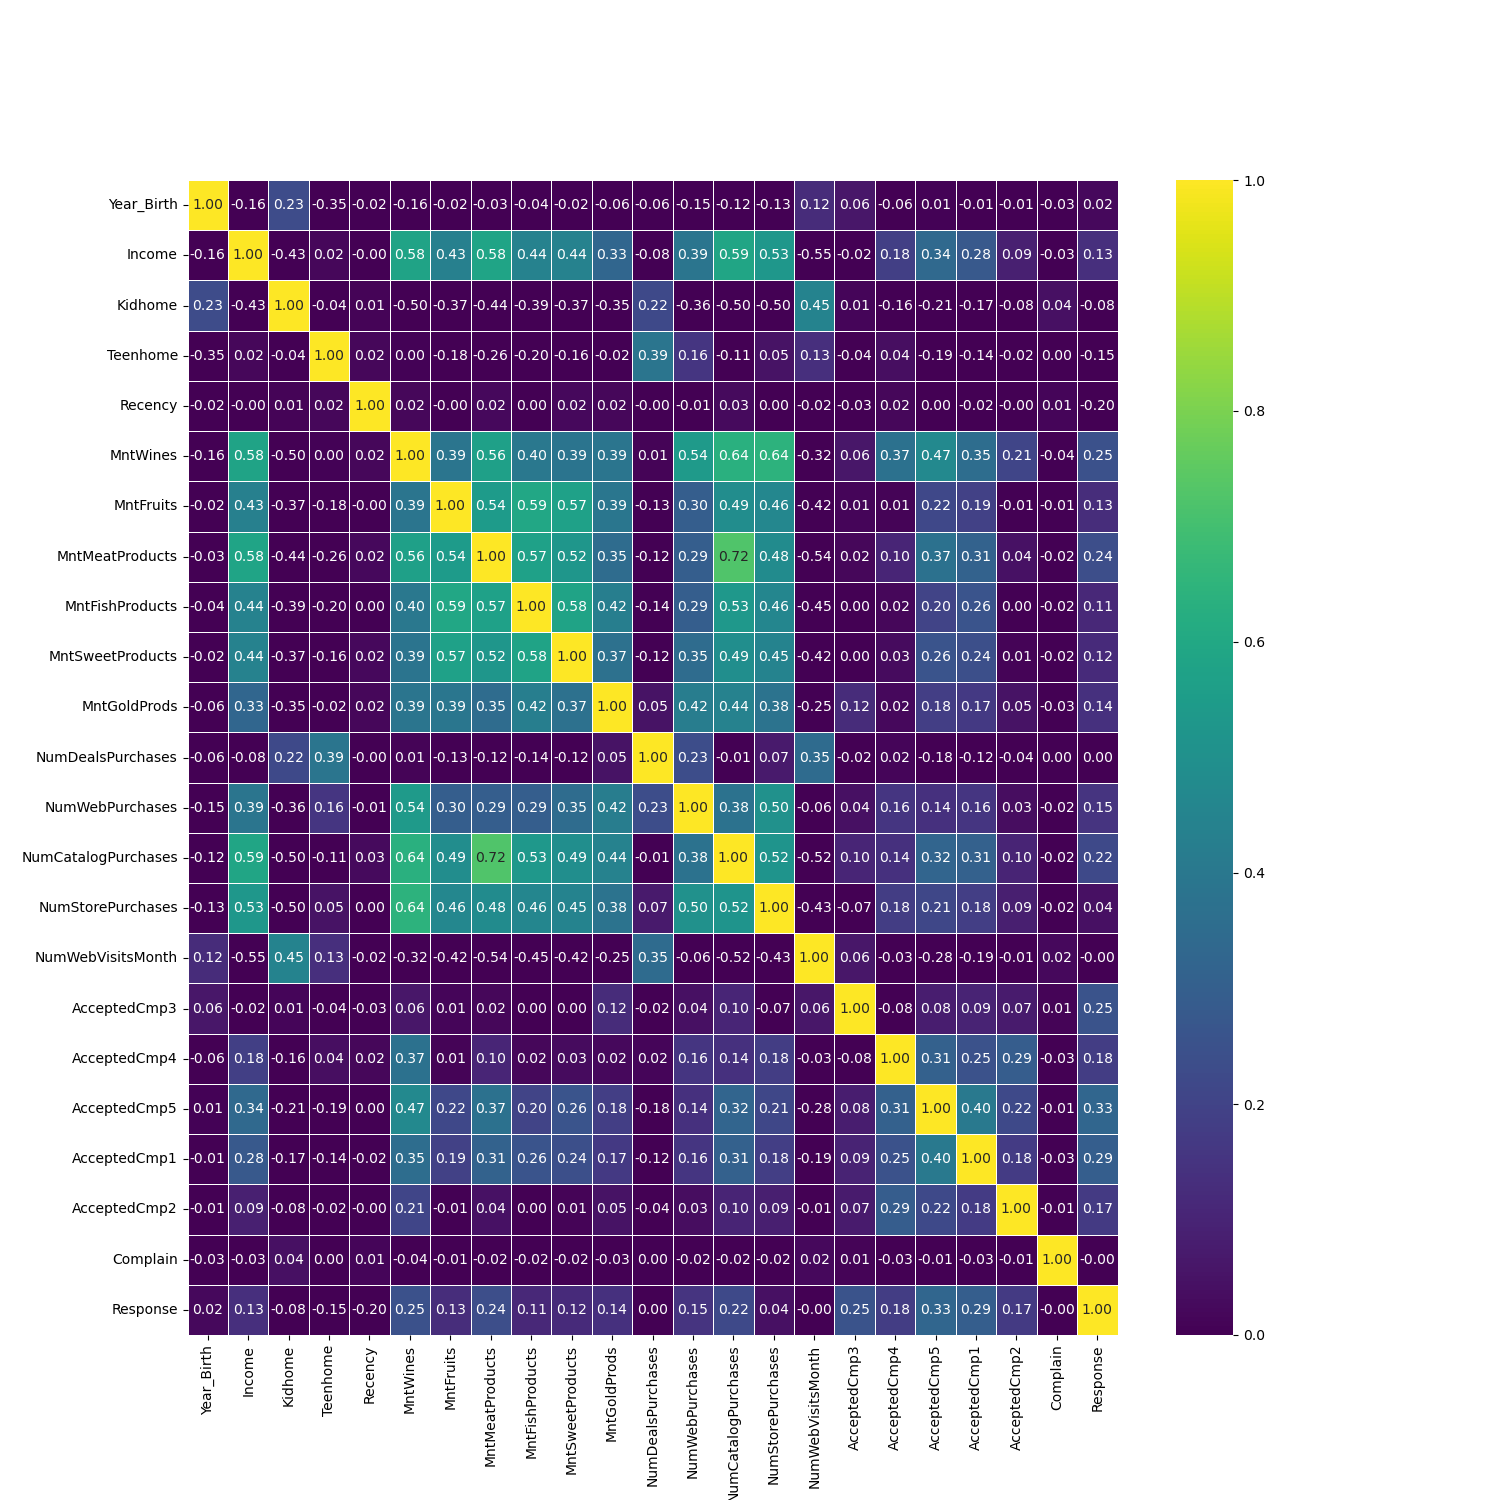 From the heatmap plot, it can be seen that the features AcceptedCmp1 and AcceptedCmp5 have the highest correlation with the target response, with respective values of 0.33 and 0.29.
Below are some features that we are likely to retain and use for future analysis:
- Recency
- MntWines
- MntMeatProducts
- NumCatalogPurchases
- AcceptedCmp3
- AcceptedCmp5
- AcceptedCmp1
From all the correlations between features and the target, they all range from 0.00 to 0.33. Therefore, we decided to set a threshold value at 0.20. The features listed above that we retained are those with correlation values >0.20.
Furthermore, based on the initial analysis of feature-to-feature relationships that we conducted for features with higher correlations with the target, we obtained the following results:
From these results, it is highly likely that they will be prioritized as features in the decision-making process for determining which customers are eligible for campaigns.
Business Insights & Recommendations
Business Insights
- What is the influence of having kidhome and teenhome on customer response rates?


-
What is the percentage of customers who Responded and Did Not Respond based on marital status?

-
What is the percentage of customers who Responded and Did Not Respond based on education level?

Business Recommendations
Based on the visualization, the Data Science team can provide recommendations for the marketing team, such as:
- From the kidhome and teenhome visualization, it can be seen that the majority of respondents come from customers who do not have children or teenagers, so the marketing team can focus campaigns on customers without children or teenagers.
- From the Marital Status pie chart, it can be seen that the majority of respondents come from customers with “Absurd” (50%) and “Yolo” (50%) marital statuses, followed by “Alone” (33%) and “Widow” (25%), so the marketing team can focus campaigns on “Absurd” and “Yolo” customers.
- From the Education pie chart, it can be seen that the majority of respondents come from customers with a PhD (20.78%) education level, followed by Master’s (15.41%), so the marketing team can focus campaigns on customers with a “PhD” education level.
Next Improvement
In addition to the three business insights, we also have one more insight regarding a trend of a product that has a strong correlation (Gold, Meat, and Wines) with campaigns 1 through 5. Then, the results of visualizing this insight can be used by the company to prioritize which products to sell or promote in order to attract more customers. Therefore, it is hoped that with an increase in the number of customers, the company’s revenue will also increase.
However, due to time constraints, we have not had the opportunity to create visualizations for this last insight and plan to make it a next improvement.
Data PreProcessing
Data Cleansing & Feature Engineering
Handle Missing Values

Based on the initial analysis, it can be observed that there are missing data in the income column totaling 24 rows, with a percentage of 1.07% of the total data, which is far below the safe data deletion threshold (10%). Therefore, the decision we made regarding the missing value is to delete all rows in the Income column with null (empty) values.

Handle Duplicated Data
Based on the checking results, no duplicated data rows were found. Therefore, we do not need to handle duplicated data.
Handle Outliers


Based on the plots shown above, outliers exist in the ‘Income’, ‘Year_Birth’, ‘Recency’, ‘MntWines’, ‘MntFruits’, ‘MntMeatProducts’, ‘MntFishProducts’, ‘MntSweetProducts’, ‘MntGoldProds’, ‘NumDealsPurchases’, ‘NumWebPurchases’, ‘NumWebVisitsMonth’ features. Therefore, we made corrections to these features using the Z-score method and also the IQR method to minimize the number of outliers contained in the dataset.
Remove Outliers berdasarkan Z-score

Remove Outliers berdasarkan IQR

Based on the calculations using Z-score and IQR, it can be seen that the number of rows deleted based on IQR is much higher than based on Z-score, which is about >30% of the total data rows deleted. Therefore, we decided to choose the Z-score method for removing outlier rows.
After that, we plotted boxplots to re-examine the distribution of outliers in each feature.


Feature Transformation


Based on the plots shown above, there is positively skewed data in the ‘MntWines’, ‘MntFruits’, ‘MntMeatProducts’, ‘MntFishProducts’, ‘MntSweetProducts’, ‘MntGoldProds’, ‘NumDealsPurchases’, ‘NumWebPurchases’, ‘NumCatalogPurchases’ features. Therefore, we made adjustments to these features using the log transformation method.

Log Transformation


Based on the re-check of some features that have been processed using the log transformation previously, it can be seen that all skewness values now have a more uniform range (not too far and not too varied). Therefore, it can be concluded that the feature transformation technique we have done is valid, and we decided to create a new column with the filled values of the features that have been processed.

Feature Encoding
After performing feature transformation, here we also decided to perform feature encoding on columns that have categorical data types to be converted into numerical. We did this in the hope of improving the machine learning capabilities we would create later. Below are some features we processed at this stage:
- Mapping_marital, based on Marital_status
- Mapping_education, based on Education
Label Encoding
Mapping_marital, based on Marital_status
 Mapping_education, based on Education

One Hot Encoding


Feature Extraction
After performing feature encoding, we also decided to perform feature extraction at this stage. We did this with the aim of facilitating the feature selection step that would be done next. Below are some features we created at this stage:
- primer_purchase & tersier_purchase, a feature that combines columns of fruit, meat, and fish purchases, wine, sweet food, and gold into 2 groups, namely primary and tertiary.
- total_accepted_campaign, a feature that combines acceptedcmp 1 - 5. This feature was created to see the intensity of customers in accepting campaigns from all campaigns previously carried out by the company.
- total_revenue, a feature created by summing the total acceptance of customers in all previous campaigns (1-5) with the amount of revenue per accepted campaign.
- total_spent, a feature that combines total purchases of various products ranging from wines, fruits, meats, fish, sweets, to gold to summarize the total expenses incurred by each customer.
- total_order, a feature containing a summary of the total purchases or orders made by customers from various purchase methods.
- month_customer, the month when customers start enrolling/registering for marketing campaigns.
- age, a feature that categorizes customers into 3 age groups, namely: Elderly (2), Middle Age (1), and Young (0).
- income_category, a feature that categorizes customers based on their income into 3 categories, namely High-Income (2), Mid-Income (1), and Low-Income (0)
- total_dependents, a feature that combines marital status, kidhome, and teen home columns to see the number of people in 1 household considered as household dependents.
All of these features will be re-evaluated during feature selection to see how much influence they have on the target or the probability of customer response in a campaign.
Primer and tersier product

Total accepted campaign

Total revenue

Total spent

Total purchase/total order

Convert the date of enrolment to datetime

Age_category customer according to WHO:


Income Category

Total Dependants


Feature Selection
After performing feature extraction, at this stage is when we select some features that we consider less important, especially those with low correlations with the target or other features. We did this to facilitate the ML learning process we would create later.
The images below show the heatmap before performing feature selection. The image after shows the heatmap after performing feature selection. We set the threshold at 0.19 where above the threshold, the correlation of the feature with the target is quite high, so the feature is taken. Meanwhile, feature-target with correlation <0.19 is not taken.
Before

After

Handle Class Imbalance
Ratio Check for target


Use oversampling

Due to the presence of class imbalance or a very far data imbalance in the target column (response) and the number of samples learned by ML is more (1692 samples), therefore we decided to use oversampling to handle this problem.
Additional Feature
- Area/ Region: The location of the customer’s residence can affect the customer’s response rate to product purchases. The closer they live to the city center, the fewer responses they may have because of the many campaign competitions from other markets around the city.
- Time call: Time when called: during working hours or break time.
- Day call: Day when called: weekend/weekday.
- Payment method: Payment method used for purchasing goods: credit card/COD/bank transfer/e-money. Customers who use credit card methods may have a higher response rate than other payment methods.
- Job position: The type of job of the customer can affect the campaign response rate: student/professional/unemployed.
ML Modelling & Evaluation
Data Preparation
Before modeling, we split the data first to separate between training data (70%) and test data (30%).
Then, because there was an intermediate class imbalance in the target data, we decided to perform oversampling so that the machine learning algorithm or model we created could learn the data more balancedly.
Default Modelling
At this stage, we conducted exploration using all algorithms previously taught with the following results:
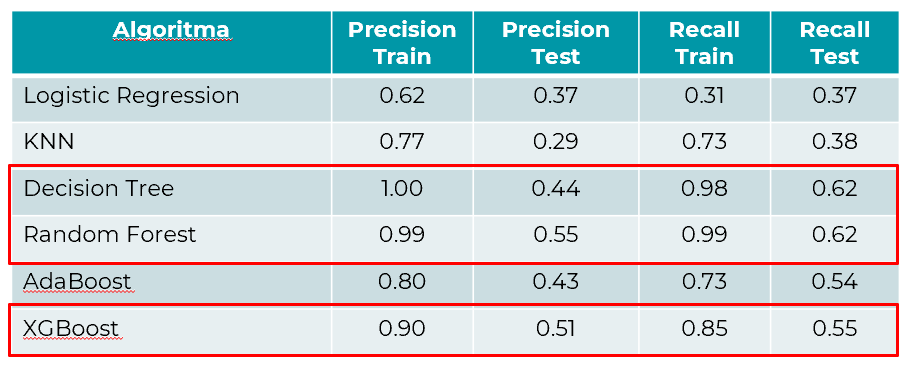
Based on these results, we decided to delve deeper into 3 algorithms with the best precision and recall results, namely Decision Tree, Random Forest, and XGBoost.
After further exploration with Hyperparameter Tuning on Decision Tree, Random Forest, and XGBoost, here is the summary of the final performance obtained:
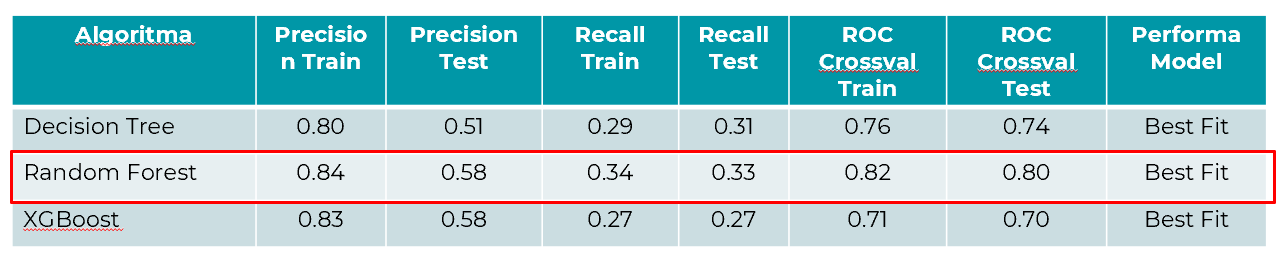
Based on the consideration of precision train value, recall, and the train-test gap obtained in these three models, it can be concluded that the most optimal model we obtained is Random Forest. This is because the model produces output with the highest precision and recall metrics values. Additionally, this model also tends to be the best fit, making it a suitable choice.
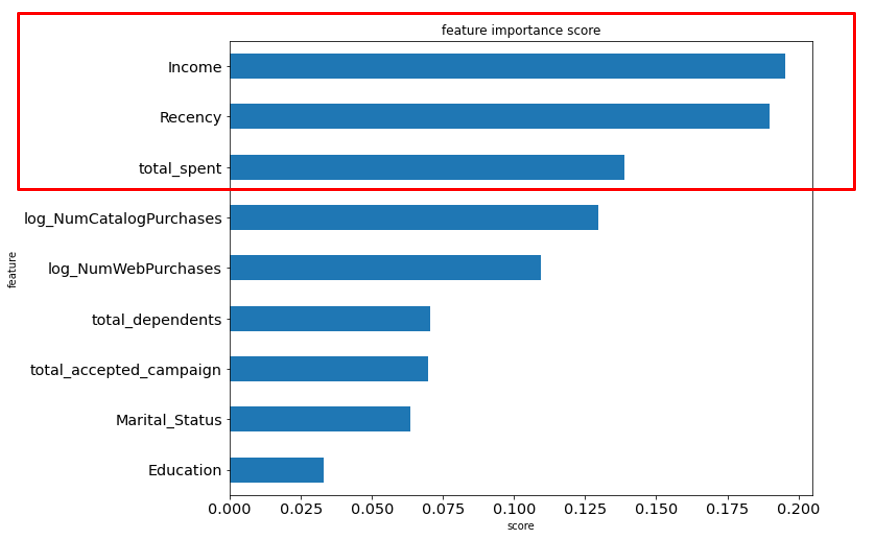
Feature Importance
From the previously selected modeling results, the following feature importance was obtained, which influences whether customers will respond to the campaign or not.
Recommendation
Income
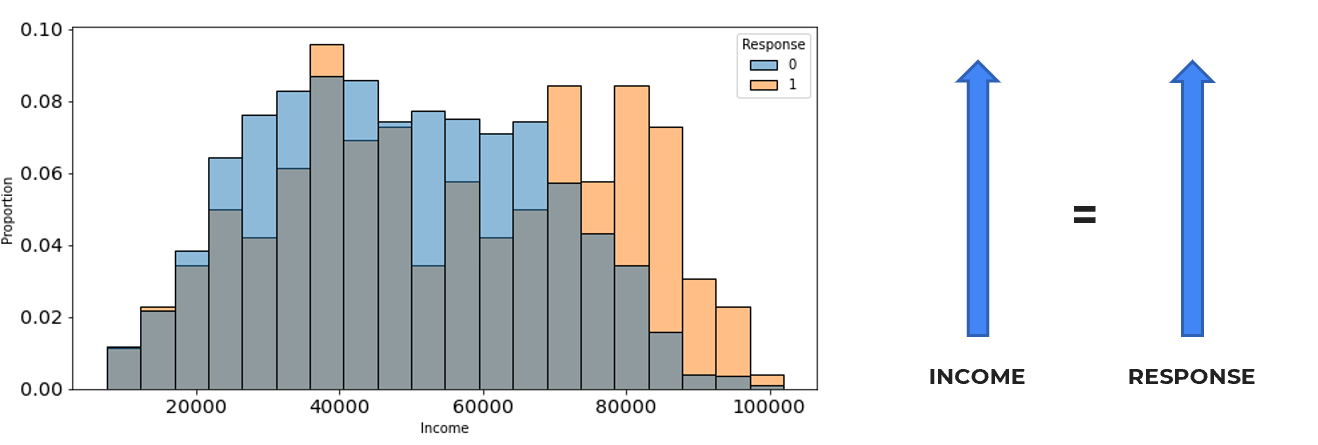 Based on the visualization results displayed above, we recommend the company to focus more on the campaign towards customers with income above 70000 to enhance campaign response. Additionally, to increase traffic, the company can implement a loyalty system by offering special points to customers meeting this criteria. These points can be redeemed for various attractive rewards such as discounts or free product offerings.
Recency
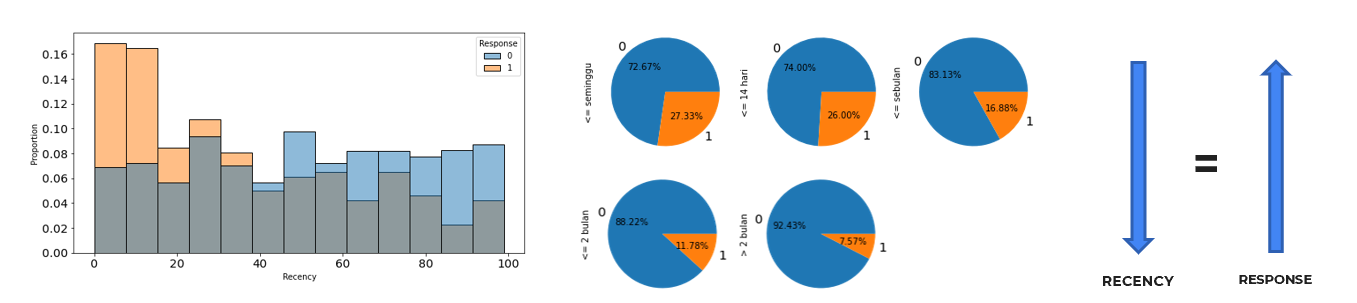 Based on the visualization results above, in the future, the company can focus more on the campaign towards customers who have recently made purchases close to the time of the upcoming campaign.
Furthermore, in the future, the company should also pay more attention to reaching out to customers who haven’t shopped for a long time or who have never shopped before by offering special promotions such as new user discount vouchers, old user discount vouchers, etc. Additionally, the company can conduct direct monthly promotions (like 2.2, 3.3, etc.) to maintain customer traffic by establishing a monthly shopping habit. Lastly, the company can also invest in placing e-billboards or other ads aimed at attracting new users in general.
Total Spent
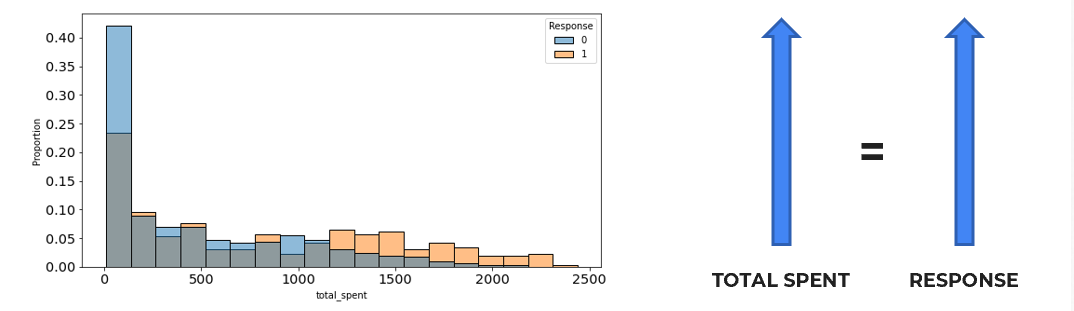 Based on the visualization results above, in the future, the company can offer special campaigns to customers who have the highest total spent before the upcoming campaign period.
Additionally, the company needs to increase customers’ total spending by improving and maintaining the quality of the products sold, for example, by consistently offering fresh produce such as fruits, fish, and meat. Moreover, the company can provide special promotions using the “up-selling/cross-selling” strategy, offering additional discounts on supporting products related to the items purchased by customers. Finally, the company can also offer special vouchers to customers with a minimum spending requirement.
Github | Google Colab | PPT | All Processes