A project to analyze the differences between annual members and casual riders in their usage of Cyclistic bikes on an hourly, daily, and monthly basis, aiming to determine the most effective marketing strategies for converting casual riders into annual members.
Authors: Jesslyn Jane. This is a project I have worked through as part of the final capstone in Google Data Analytics Professional Certificate.
Introduction
I am wearing the hat of a junior data analyst, working in the marketing analyst team at Cyclistic, a bike-share company in Chicago. Cyclistic is a bike-share program that features more than 5,800 bicycles and 600 docking stations.
The objective of this project is to understand how casual riders and annual members use Cyclistic bikes differently. From these insights, then will design a new marketing strategy to convert casual riders into annual members.
Method Approach
In this project, I will use 6 steps to ensure its completion:
- Ask
- Prepare
- Process
- Analyze
- Share
- Act
Phase 1: Ask
Business Task: The different of annual members and casual riders in using Cyclistic bikes hourly, daily, and monthly, in order to determine the best marketing strategies to convert casual riders to annual members.
Phase 2: Prepare
In this project, I will be using datasets from Google, which has been made available by Motivate International Inc. under license.
I downloaded zip files provided, then extracted to csv files from January to December 2021.
I used excel to take a glimpse of the data. Each file has information about details of the ride id, rideable type, start and end time, start and end station, latitude and longitude of the start and end stations. They show great data integrity as they have consistent columns and data types at every file.
Phase 3: Process
To begin processing the data, I used R as one of the data analytics programming languages, to import the dataset.
I checked how each file was organized, as well as made sure to clean the data. I manipulated the data, extracted the clean data to new csv and stored it. I documented the whole process of cleaning. The code can be viewed here.
Phase 4: Analyze
I organized and formatted the data. I performed some calculations and identify trends as well as relationships between each variable.
Data:
- Number of rides
- Bike Types
- Ride Lengths
- Most popular stations
Number of rides
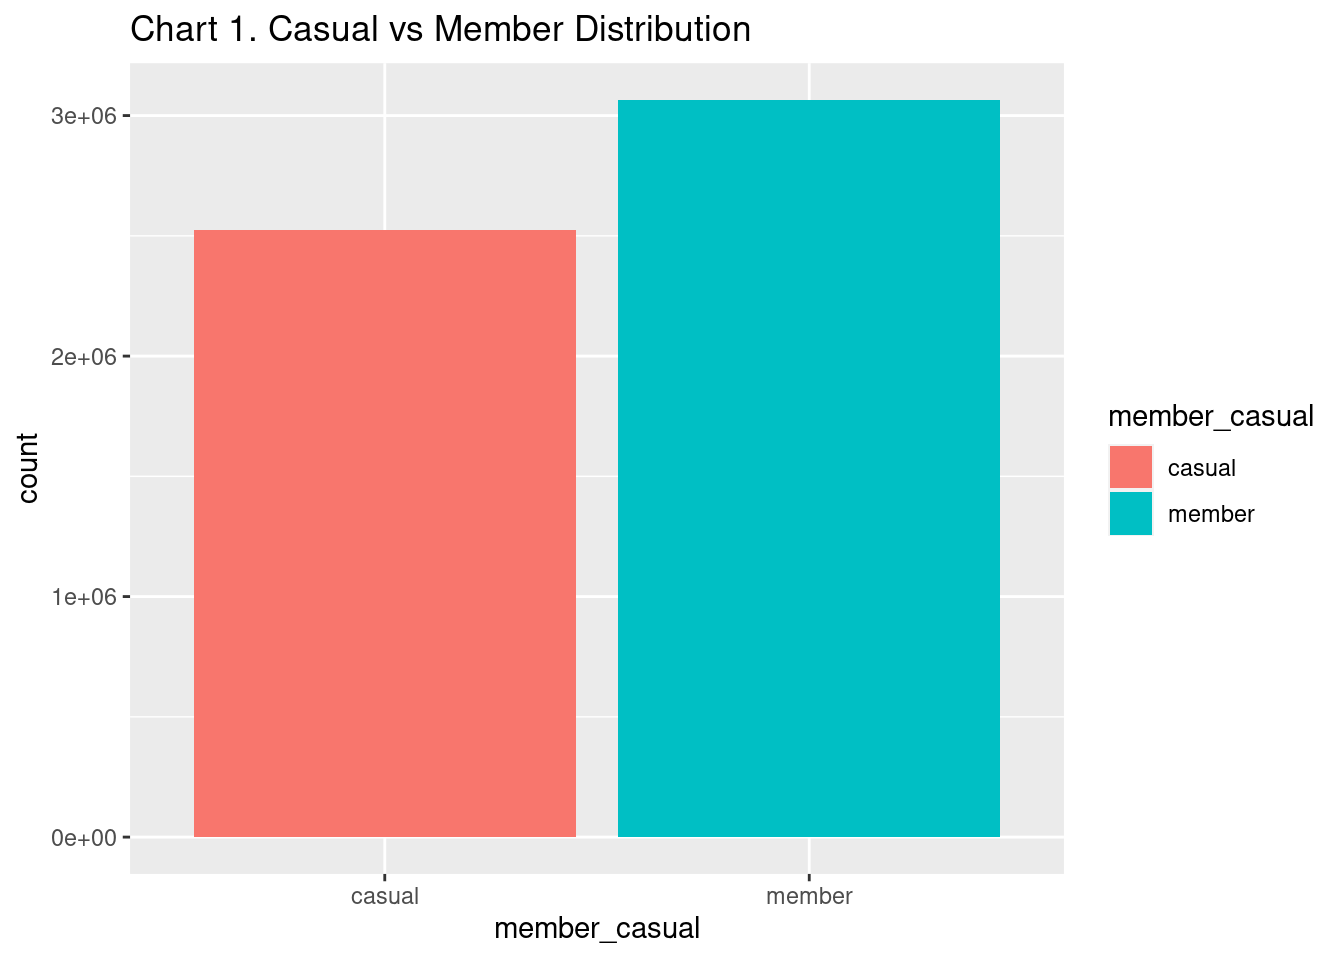
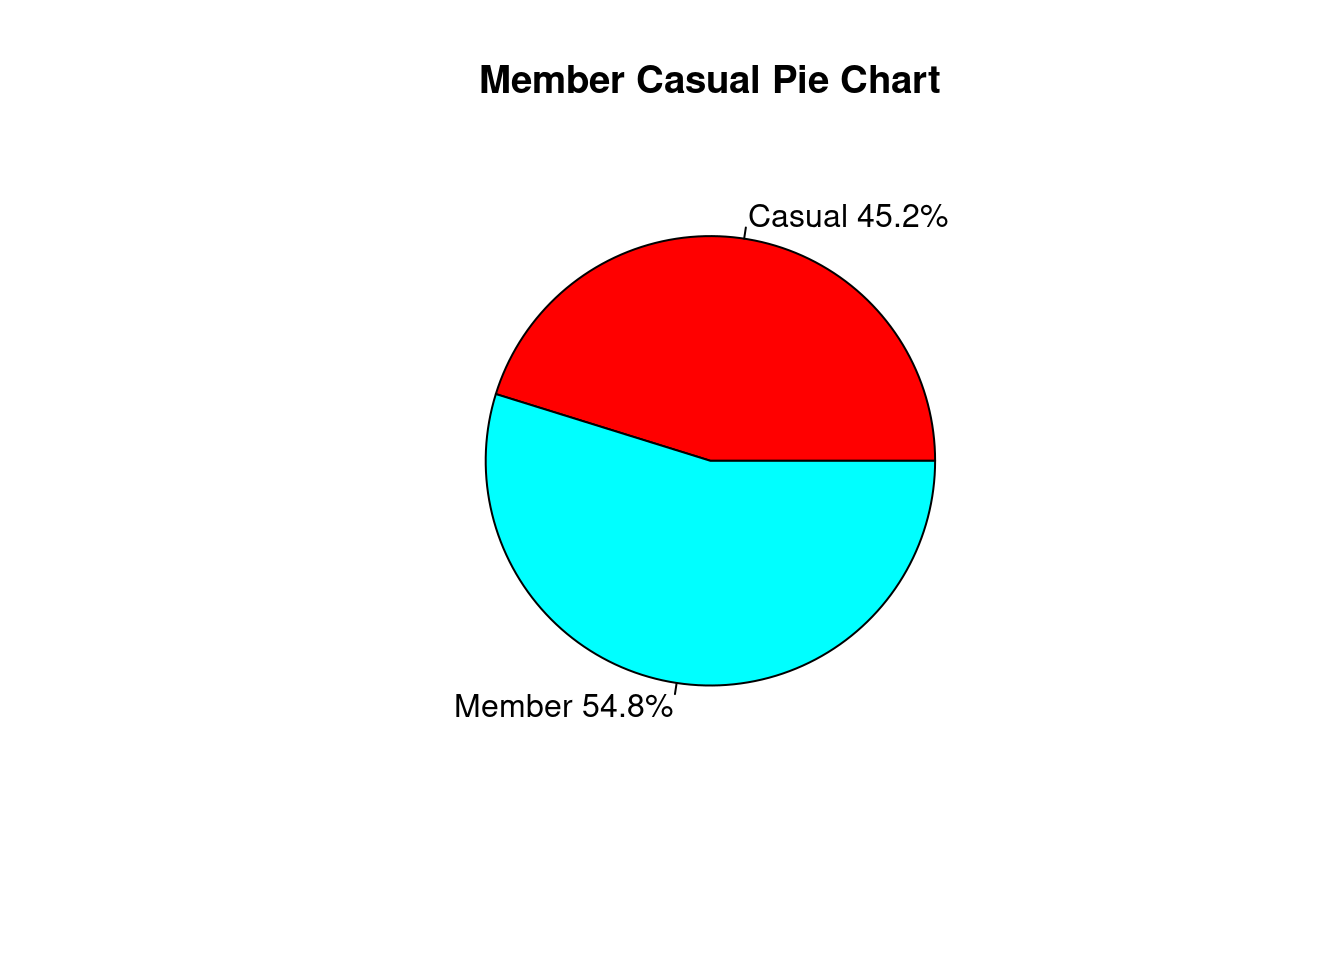
Key Takeaway:
Annual Members made the most trips in the year of 2021.
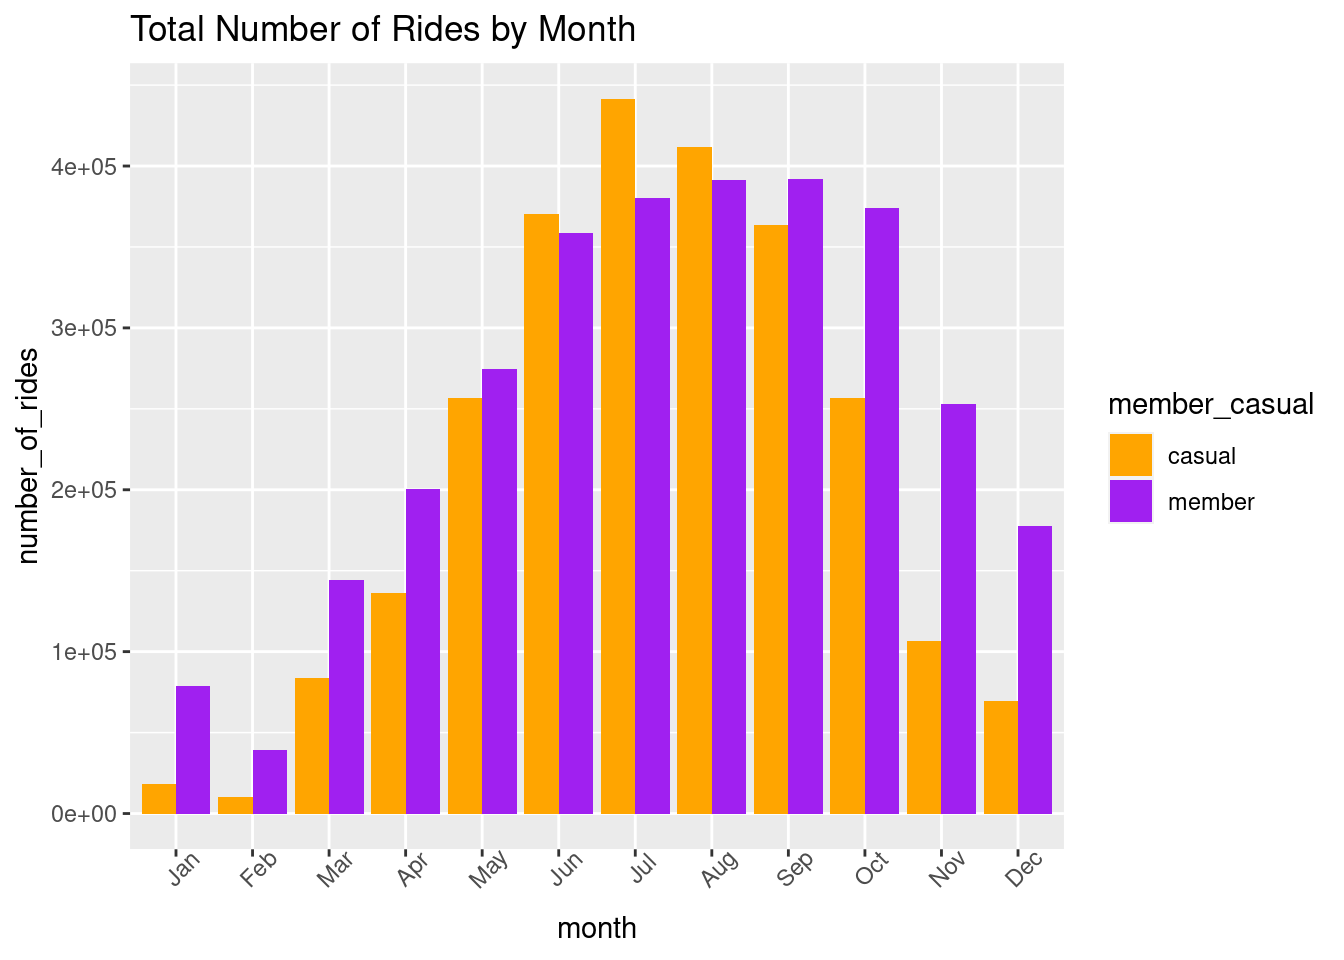
Key Takeaway:
- The busiest months for both riders were during mid-year.
- Casual riders overtook annual members on June, July, and August 2021
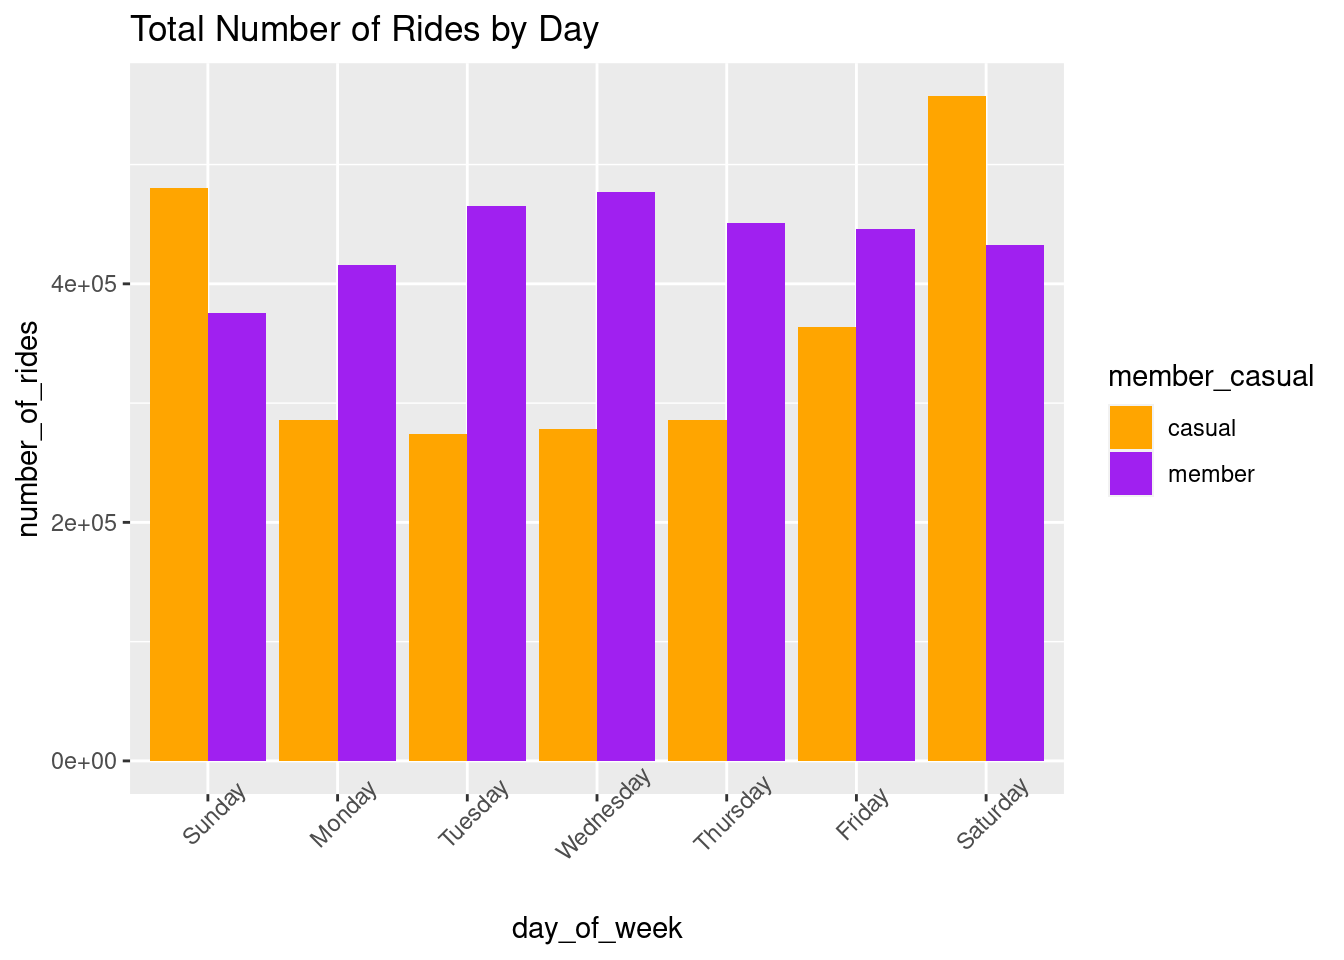
Key Takeaway:
- Trips made by Annual members are higher than Casual Riders on weekdays
- Casual riders cycled mostly on Saturday and Sunday
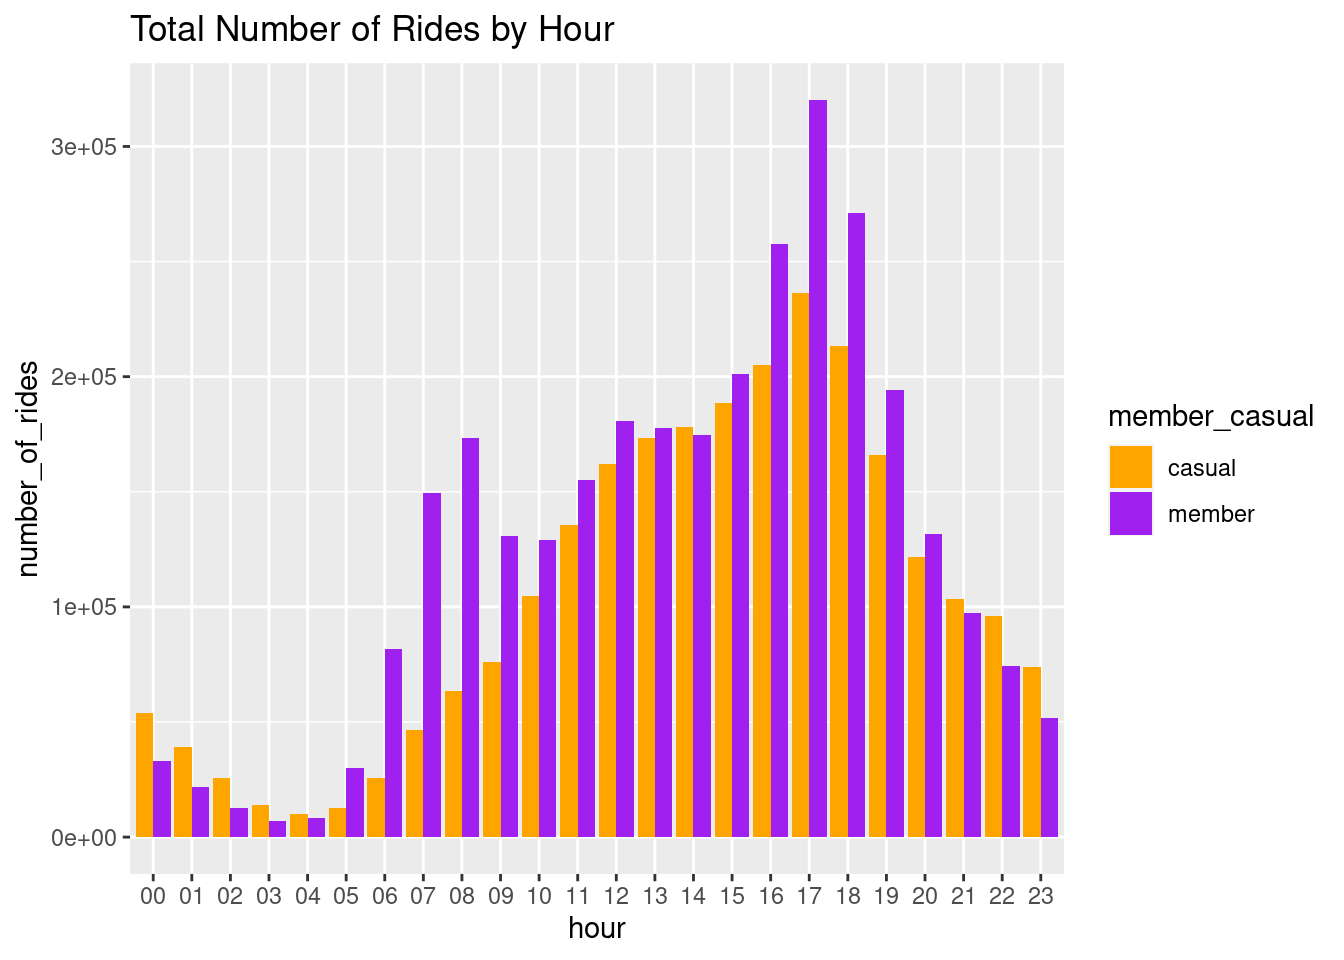
Key Takeaway:
- The peak times of rides were during:
- 100.000 → 07.00 – 09.00 am
- 200.000 → 04.00 – 06.00 pm
- Casuals use the bikes more than Members after 09.00 pm (until around 04.00 am).
Bike Types
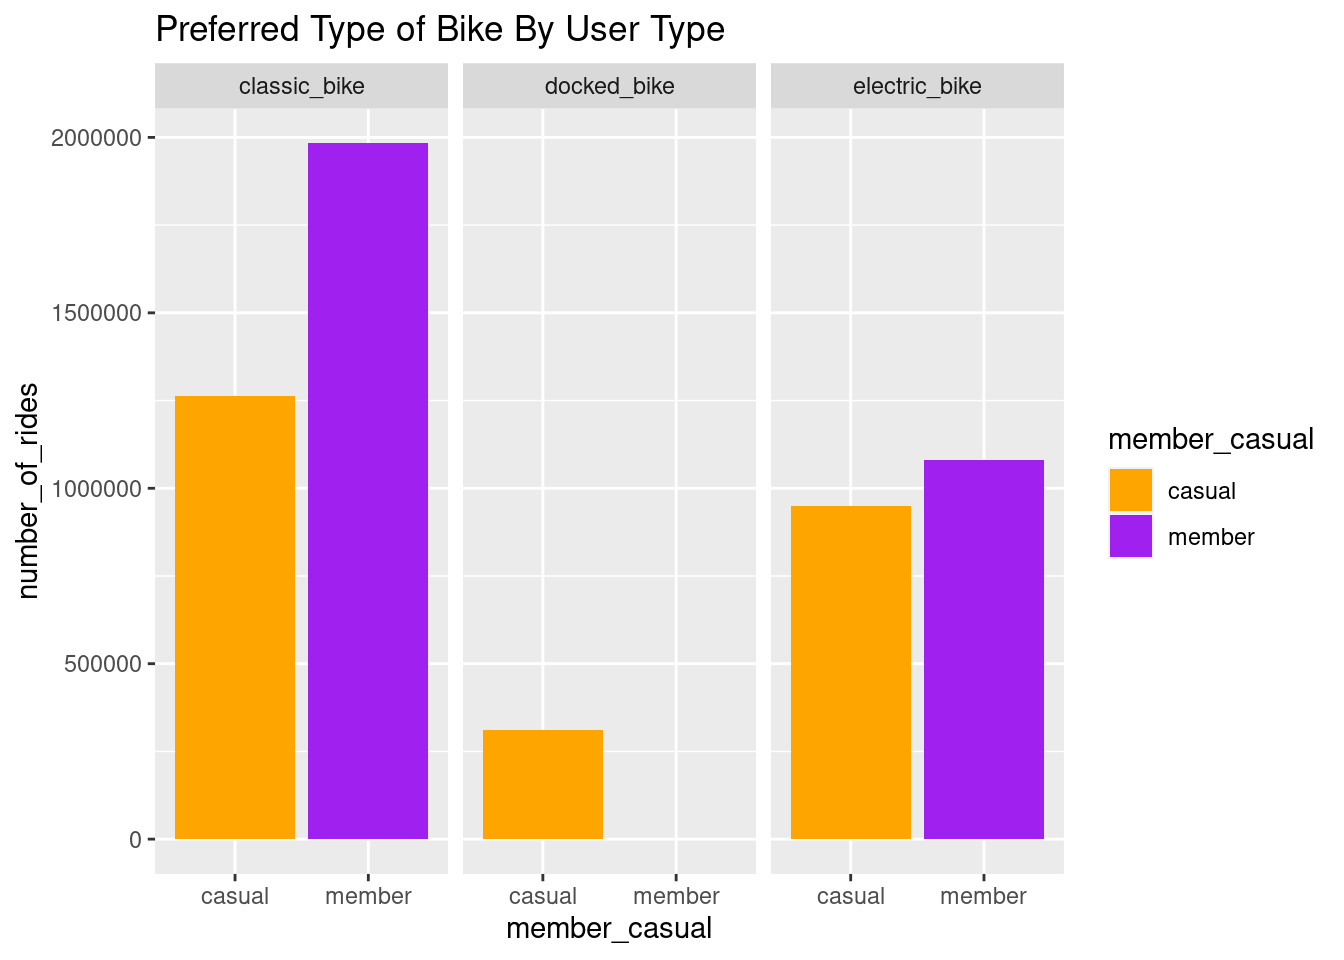
Key Takeaway:
- Classic bike were the most used, followed by electric bike and docked bike
- There was no Annual Member using docked bike
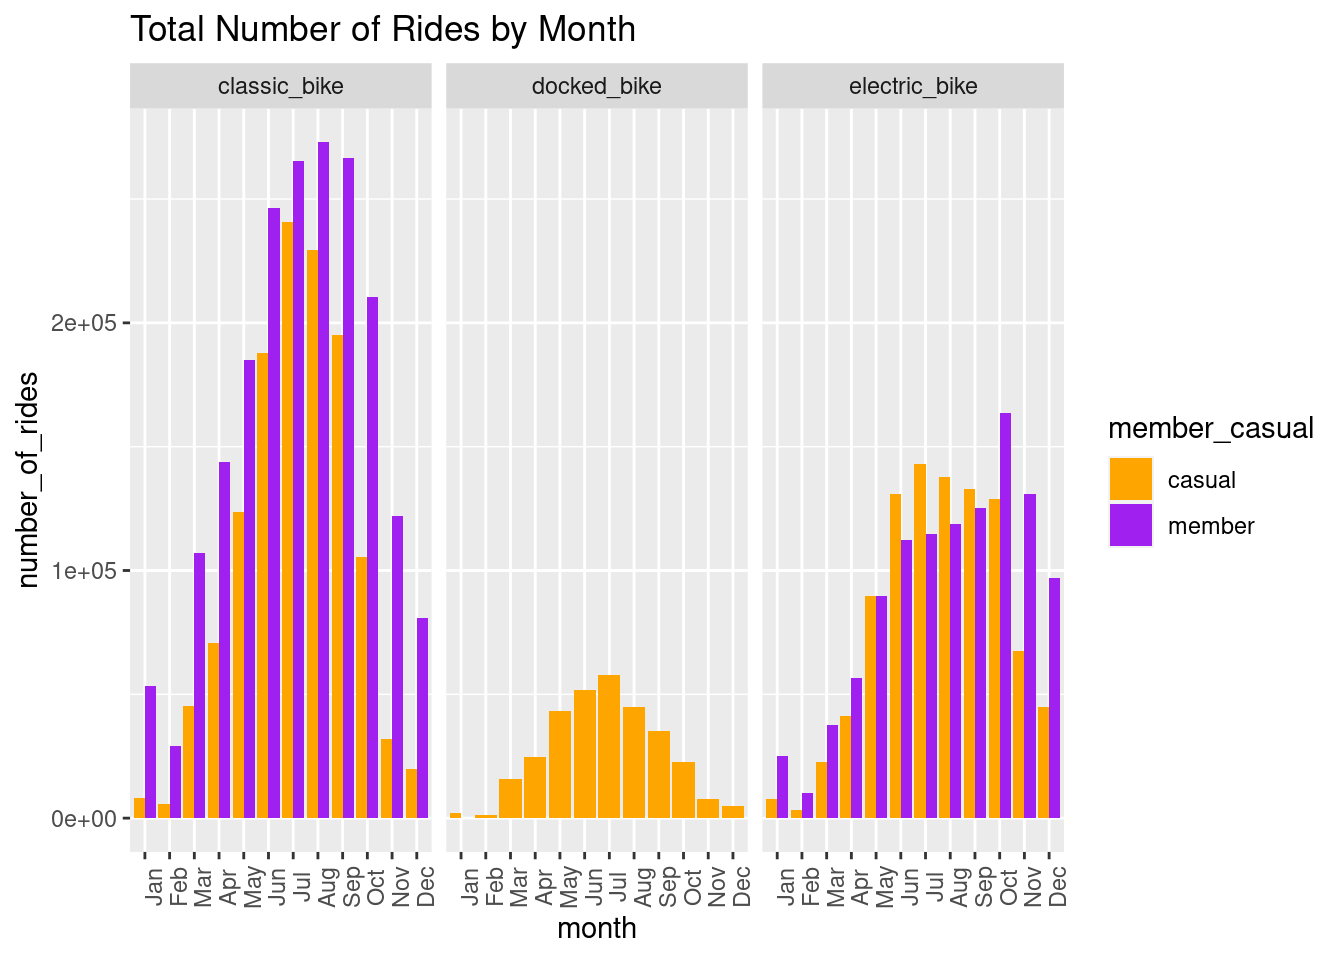
Key Takeaway:
- Classic bike were the most popular among three bike types
- There was no Annual Member using docked bike in 2021
- Ebike casual users were outnumbered the annual members in 4 months: June, July, August, September
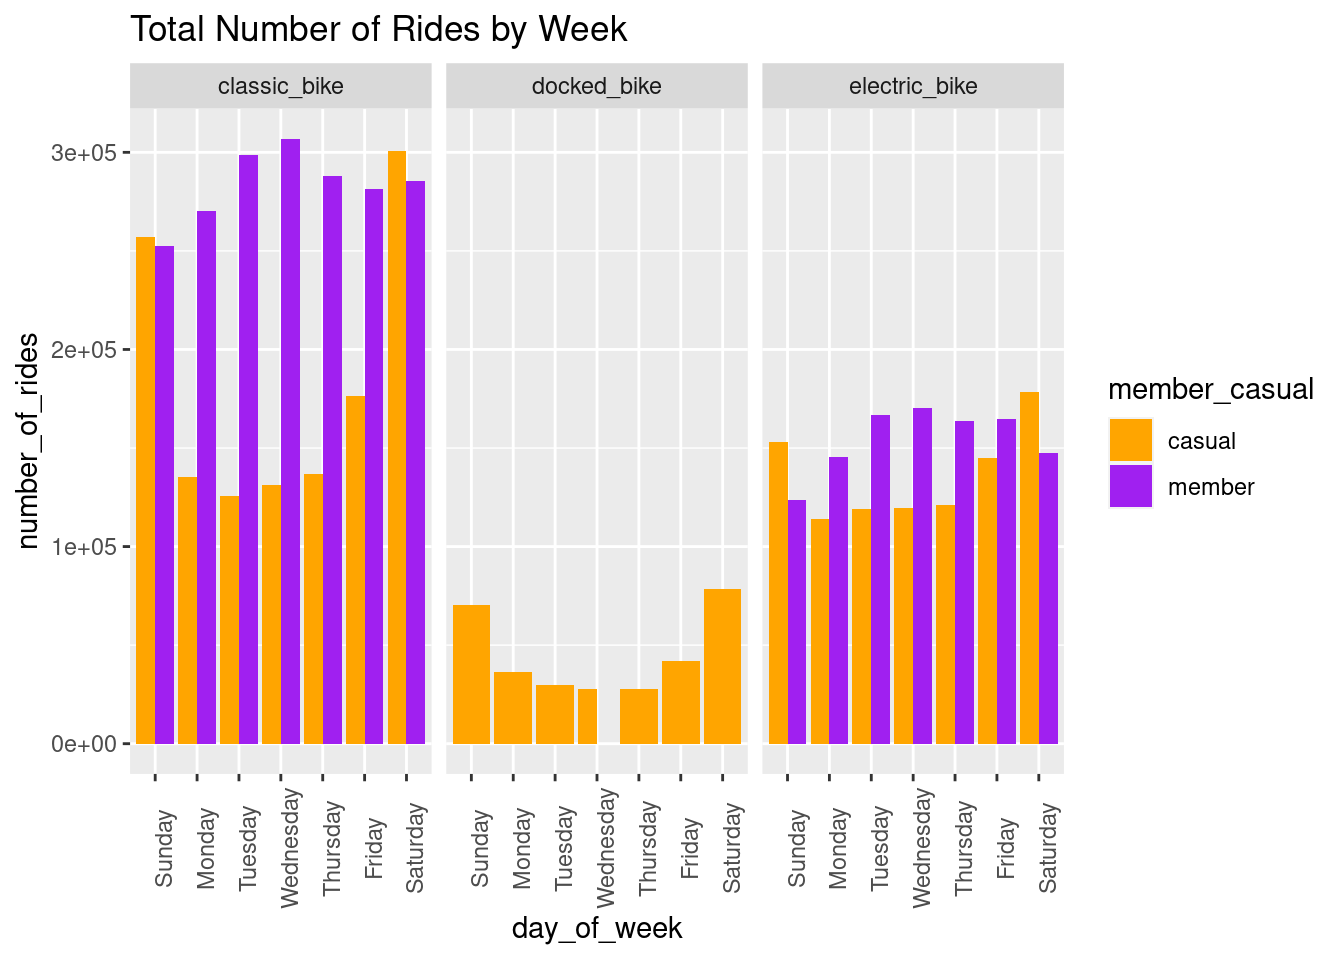
Key Takeaway:
- Casual riders used classic and electric bikes highly on weekend
- Classic bikes were used by annual members consistently throughout the week
- No members used docked bike in 2021
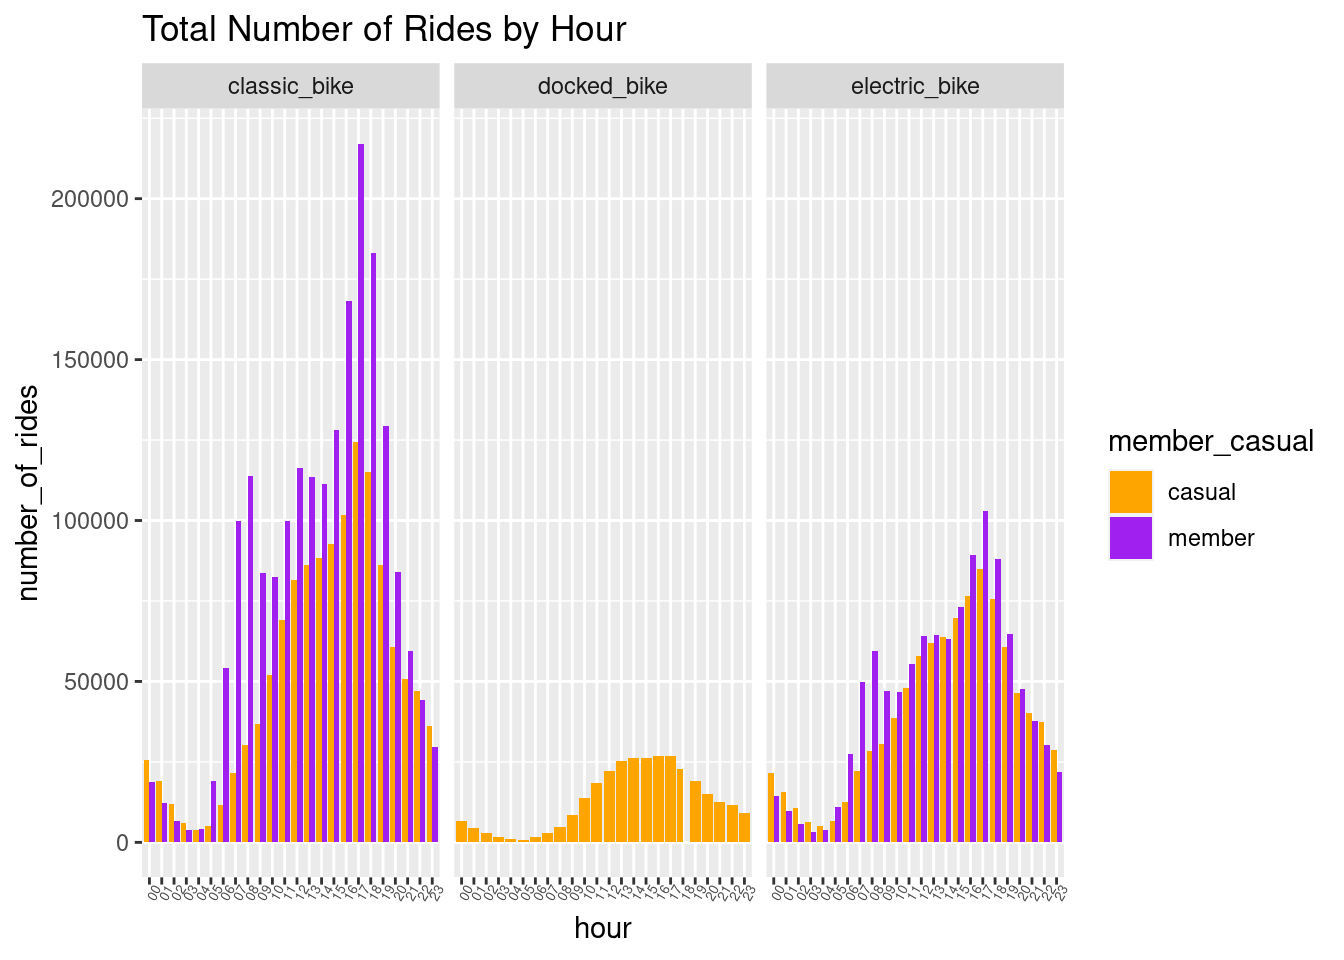
Key Takeaway:
- Peak times for classic and electric bikers were during:
- 07.00-08.00 am
- 04.00-06.00 pm
- No members used docked bike in 2021
Ride Lengths
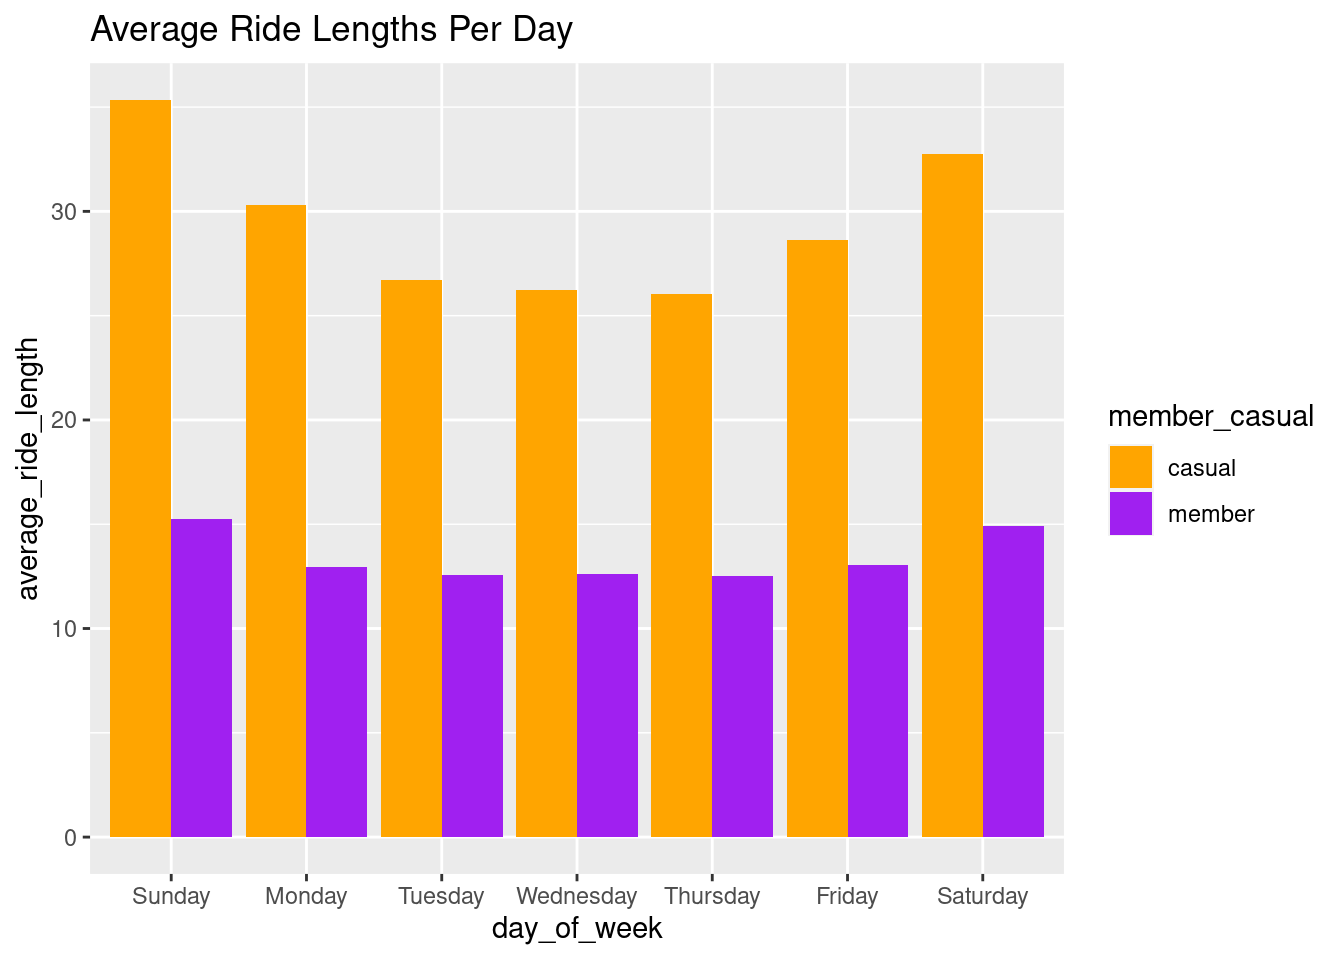
Key Takeaway:
- Casual Riders had longer trip than members throughout the week
- The average ride duration for member riders was consisteny almost throughout the week with Monday to Friday at ± 13 minutes with a slight increase to ±15 minutes over Saturday and Sunday
- The average ride duration for casual rider was ± 27-30 minutes on weekdays, and >30 minutes on weekends
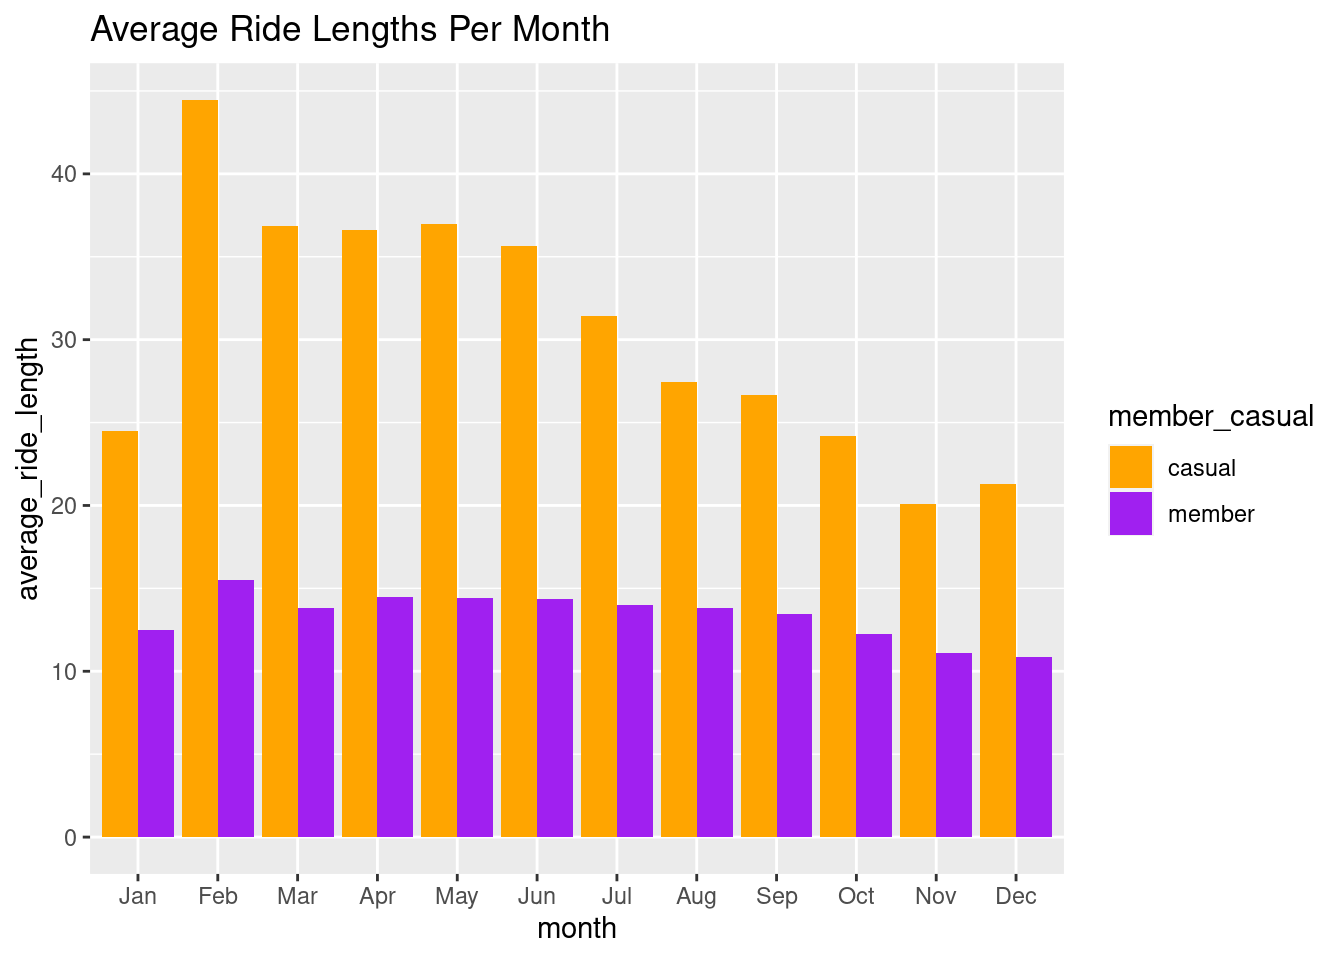
Key Takeaway:
- Casual Riders had longer trip than members throughout the year
- The average ride length for member riders was consistet in 2021, with ± 15 minutes every month
- The average ride length for casual rider was fluctuative in 2021, with the highest average >40 minutes in Feb and the lowest 20 minutes in Nov
Most popular stations
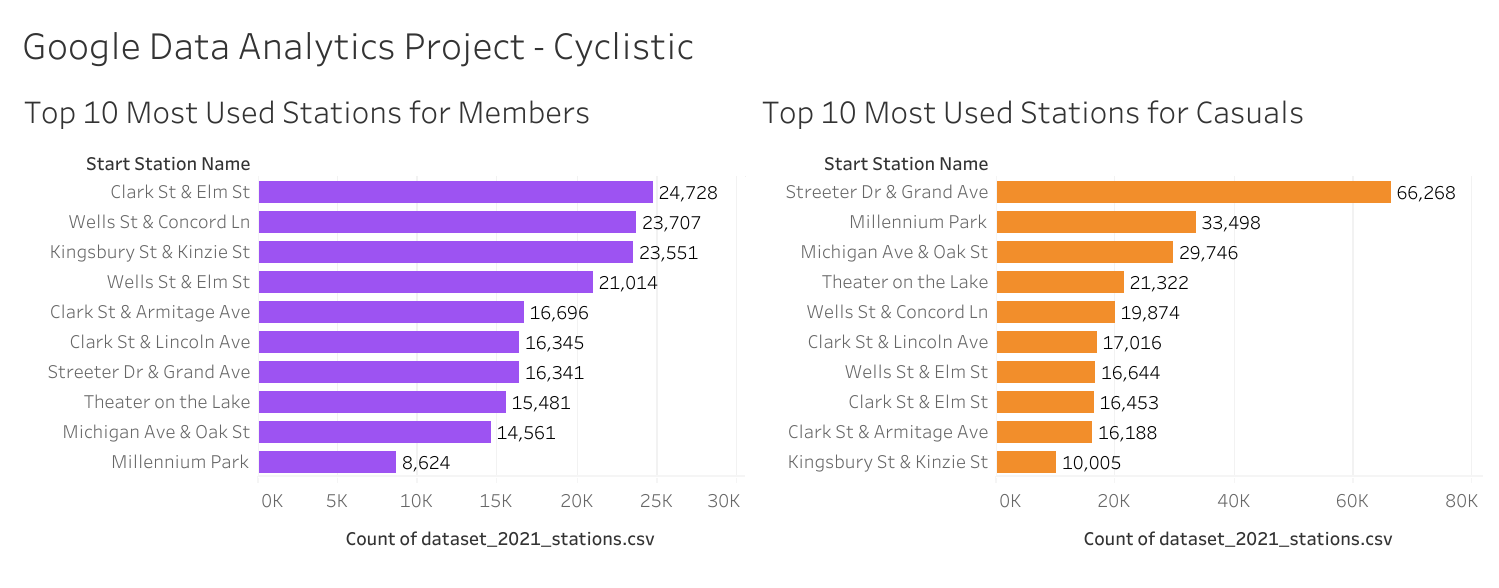
Key Takeaway:
- The most used stations for members in 2021 is Clark St & Elm St
- The most used stations for casuals in 2021 is Streeter Dr & Grand Ave
Phase 5: Share
Some conclusions we can draw from the data:
- In the period of 2021, members made trips more than casual riders
- The peak season of the year was during June-September
- The climax of the week was during weekend
- The climax of the day was during 7-9 am and 4-6 pm
- Both riders preferred Classic and Electric bikes over Docked bikes
- Annual Members mainly used the Clark St & Elm St Station, while Casual Riders mostly used the Streeter Dr & Grand Ave station
Phase 6: Act
Business Suggestions
This is the hardest part of all phases, as I am still new in business as well as marketing. These are the three top recommendations for the marketing team to convert casual riders to annual members:
- Marketing team can design campaign focusing on the usage of bicycles regularly, by highlighting the environmental and health benefits, encourages people to download mobile apps to monitor their health, and provide reward system. Besides, providing coupons or discounts might increase riders in winter season.
- Increase the number of classic bikes availability from June to September as the total number of rides were high during these months.
- Production team can decide to launch more product of bicycles on top 10 stations during peak seasons : monthly (June – September), daily (weekend), hourly (4 – 6 pm)
Further analysis
The cyclistic dataset has not completed yet without further studies, such as:
- Check docked bike technical problem, find why there was no docked bike used for member riders
- The number of rides were higher during summer season (June - September), check if the pattern is consistent with other years