An article aimed for sharing QGIS as a tool for creating maps across the world.
Author: Jesslyn Jane
Introduction
Geographic Information Systems (GIS) have revolutionized the way we understand and interact with spatial data, offering powerful tools for mapping, analysis, and visualization. One of the most famous softwares in this field is QGIS, an open-source GIS application.
Last month, I decided to delve deeper into the world of GIS by subscribing to a comprehensive QGIS course. This course is provided by Udemy, which title is Map Academy: get mapping quickly, with QGIS. This course covers everything you need at fundamental level, provides some tips and tricks for QGIS, and in-depth maps across the world.
In this article, I will share my journey through this course, highlighting the key learning points and skills I acquired. I hope my experience will provide valuable insights and inspire you to explore the world of QGIS.
Learning Experience
In general, you need around 15.5 hours to finish the course with total 14 moduls in which each modul has its own assignment. From total of 14 moduls, I’ll summarize the key takeaways of some moduls that I find interesting.
Before delving deeper into the main material, I suggest you to do the installation in their website. According to the course, the speaker suggests to install the version that has ‘LTR’ next to it. Since my laptop has equipped with QGIS beforehand, I’ll just use the one I have which is 3.32.2.
1. Introduction to QGIS Interface and Tools
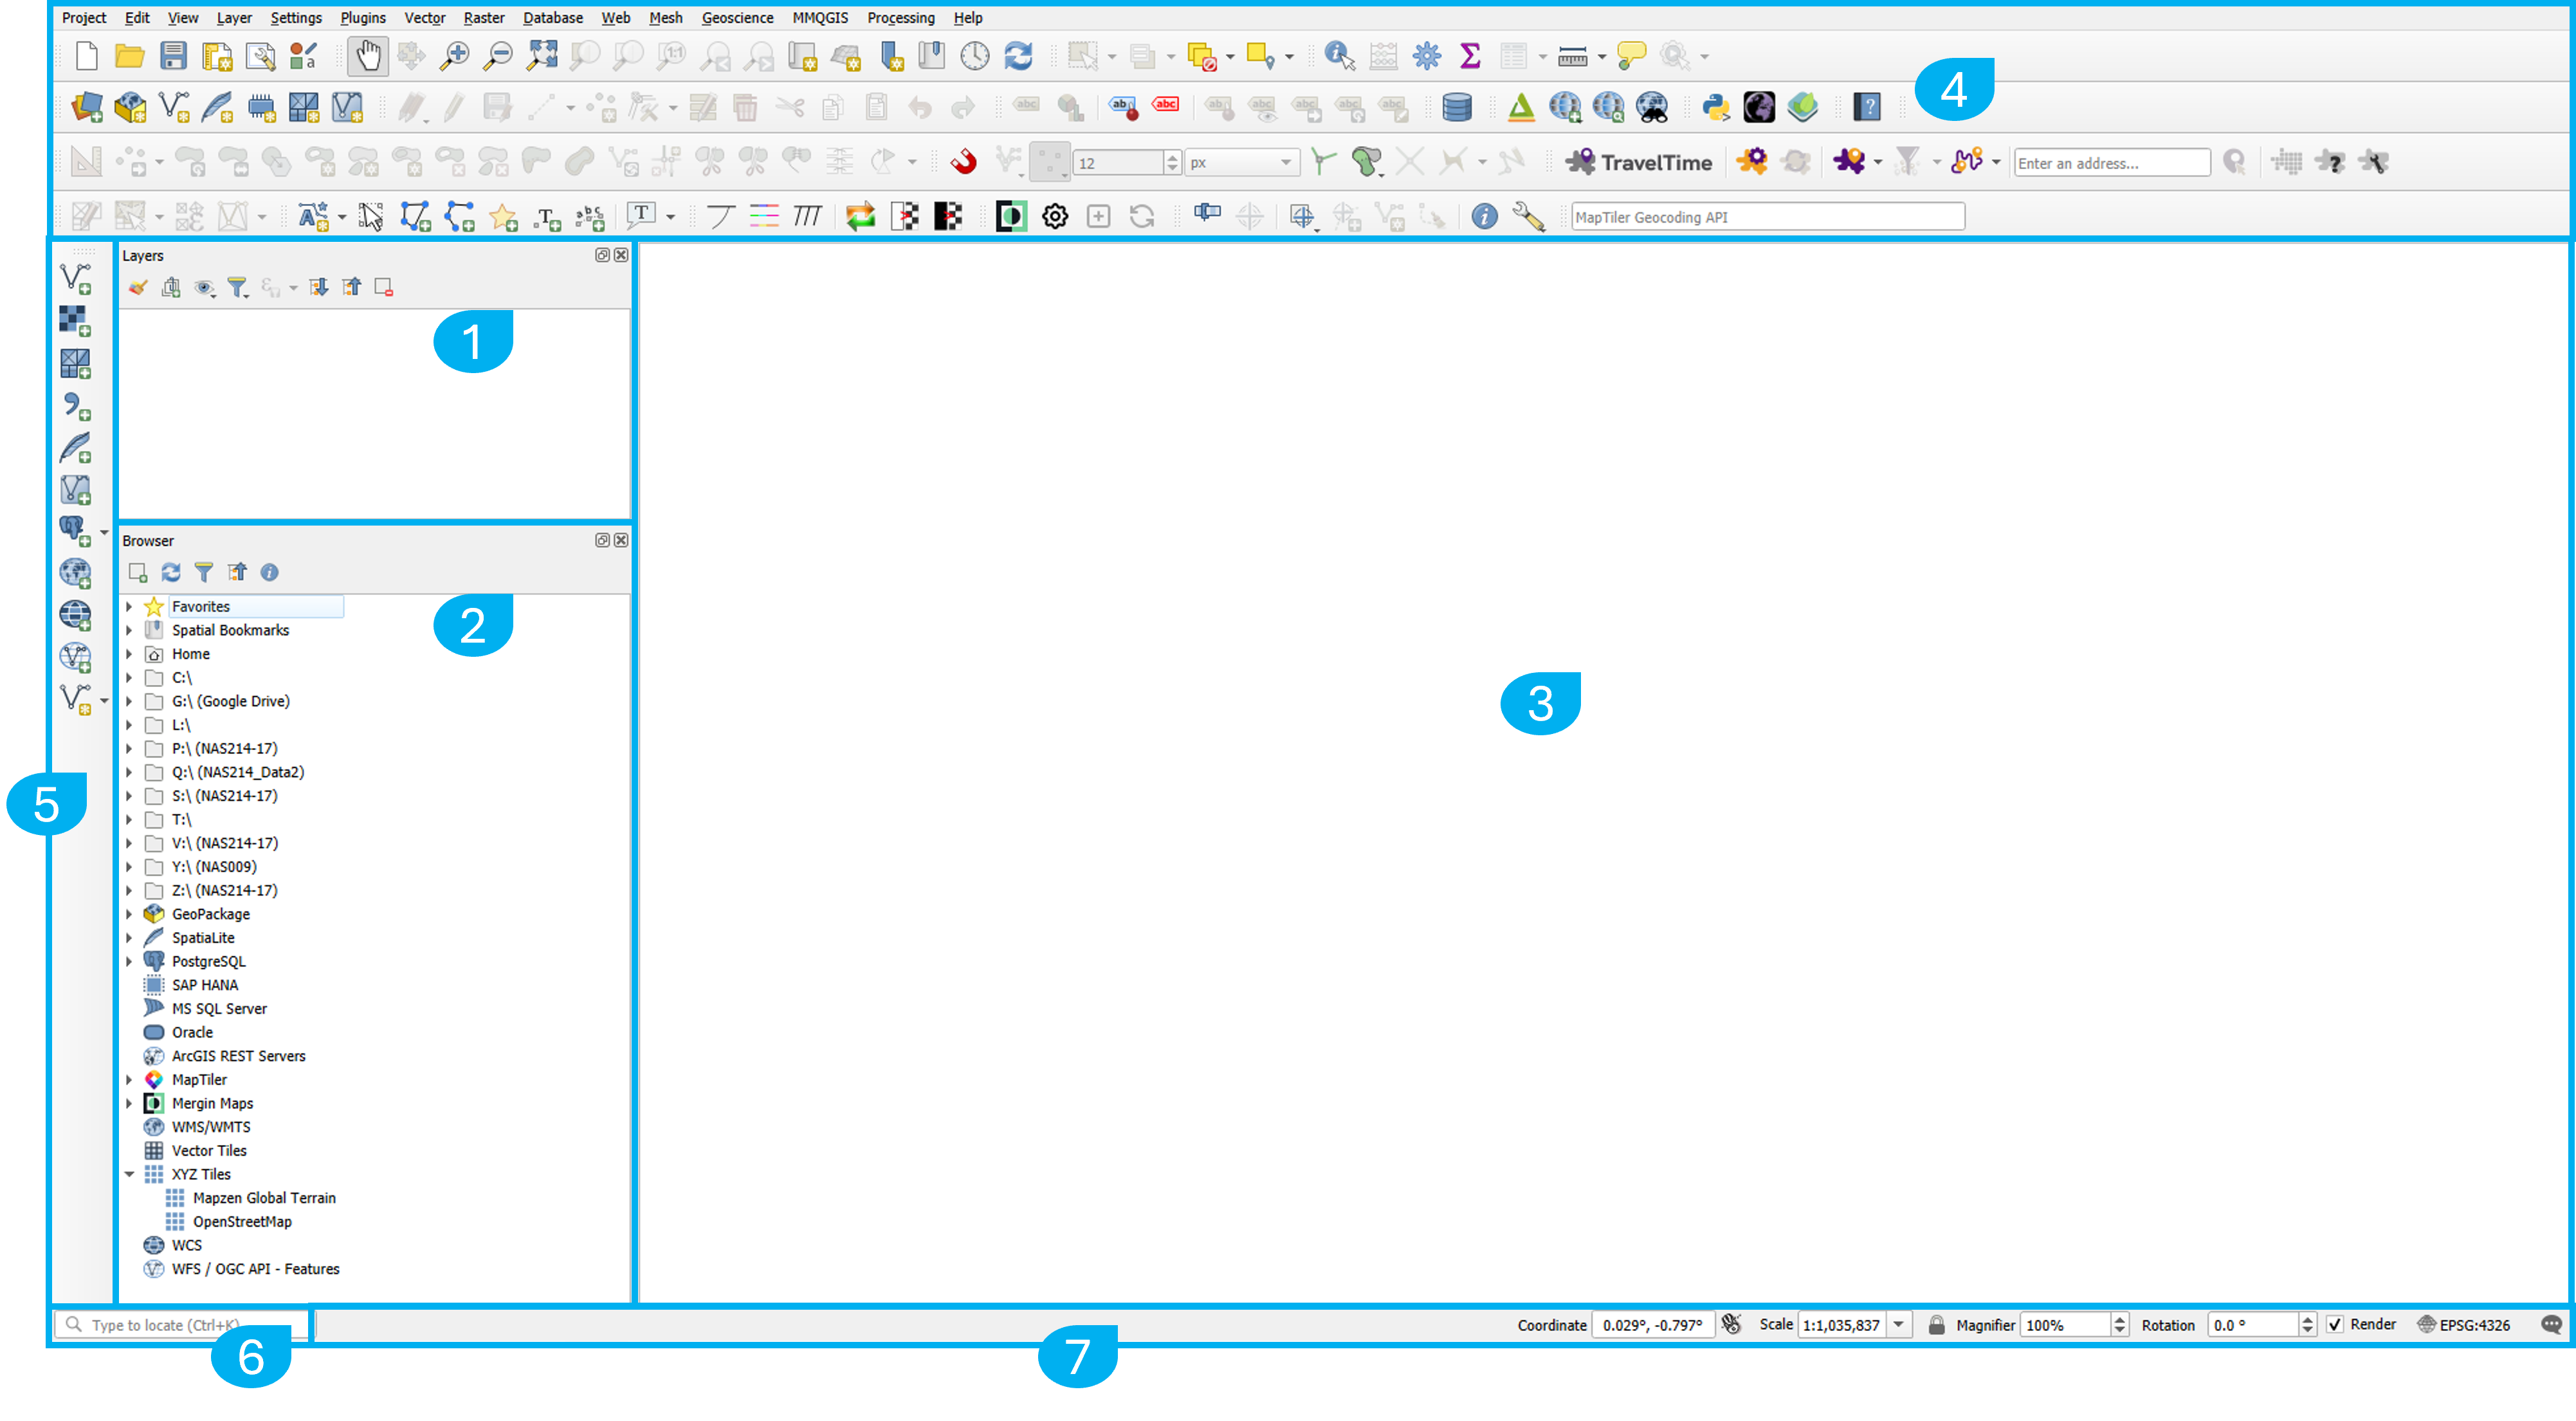 The components highlighted in the figure above are:
- Layer List
- Browser Panel
- Map Canvas
- Toolbars
- Side toolbars
- Locator bar
- Status bar
Each component has its own function. To understand deeper, please feel free to visit QGIS documentation on the docs.qgis.org.
2. Create Maps
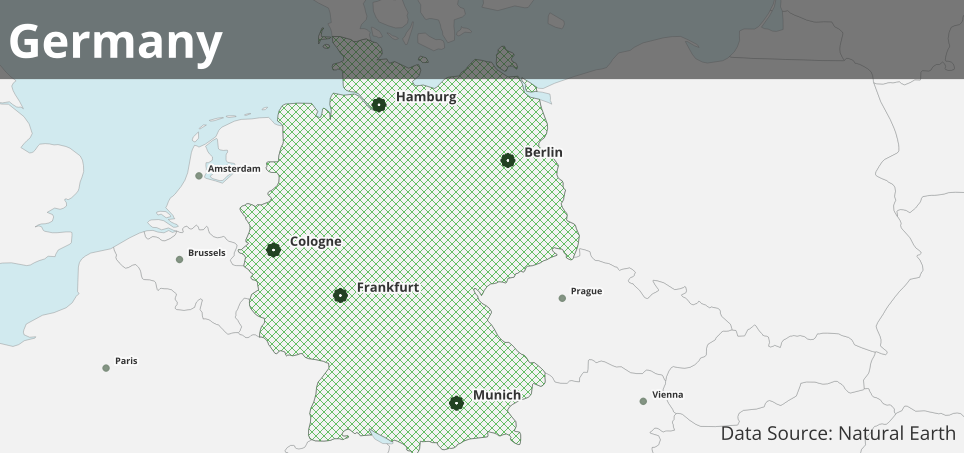
In this section, we learn how to obtain data and add it to QGIS, change the color of layers, read the attribute table, create a basic world map, and use the layer styling panel. At the end of this section, we are asked to create a map of our own country. Since the instructor demonstrated with Indonesia (I am from Indonesia), I decided to create a map of one of my dream countries: Germany.
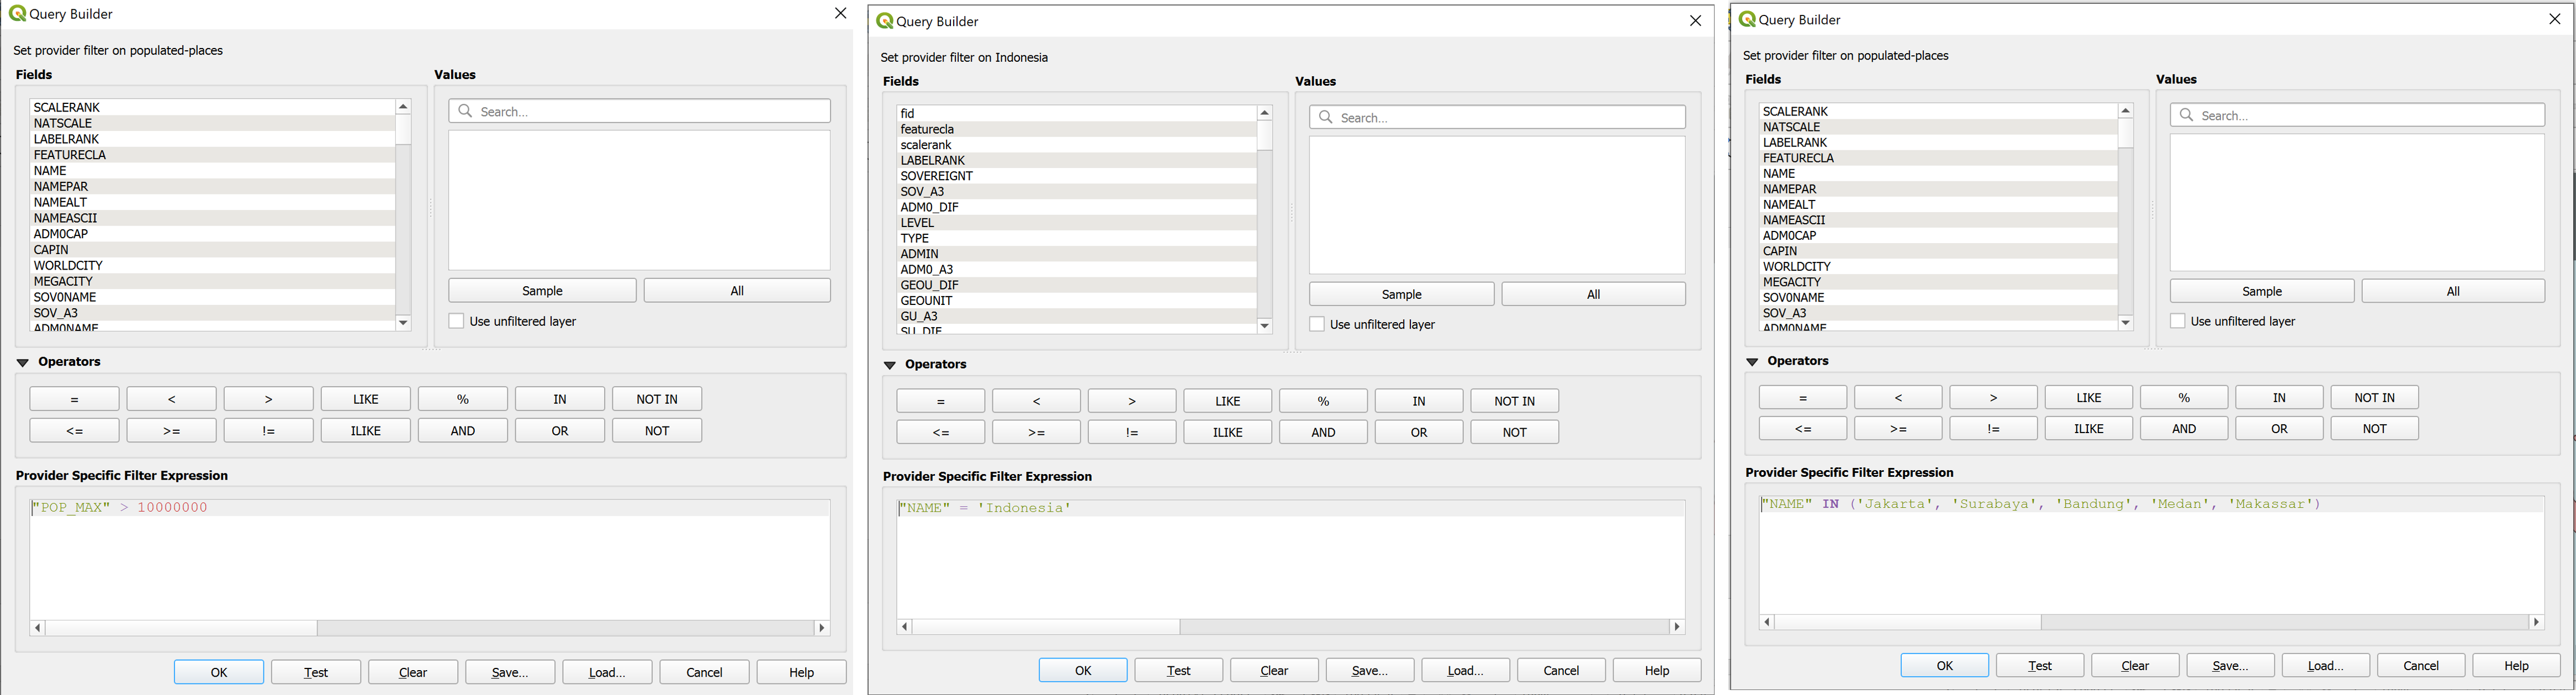
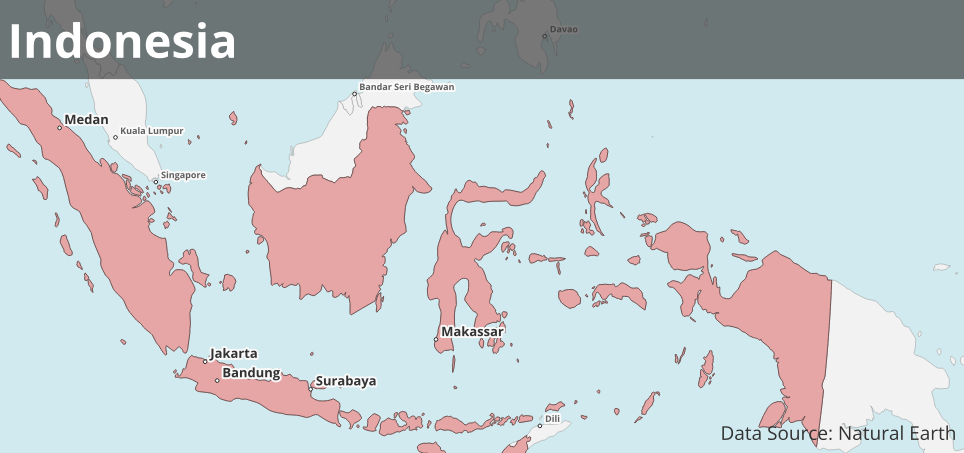
To be able to show the name of some large cities, we can use filter option, as shown below.
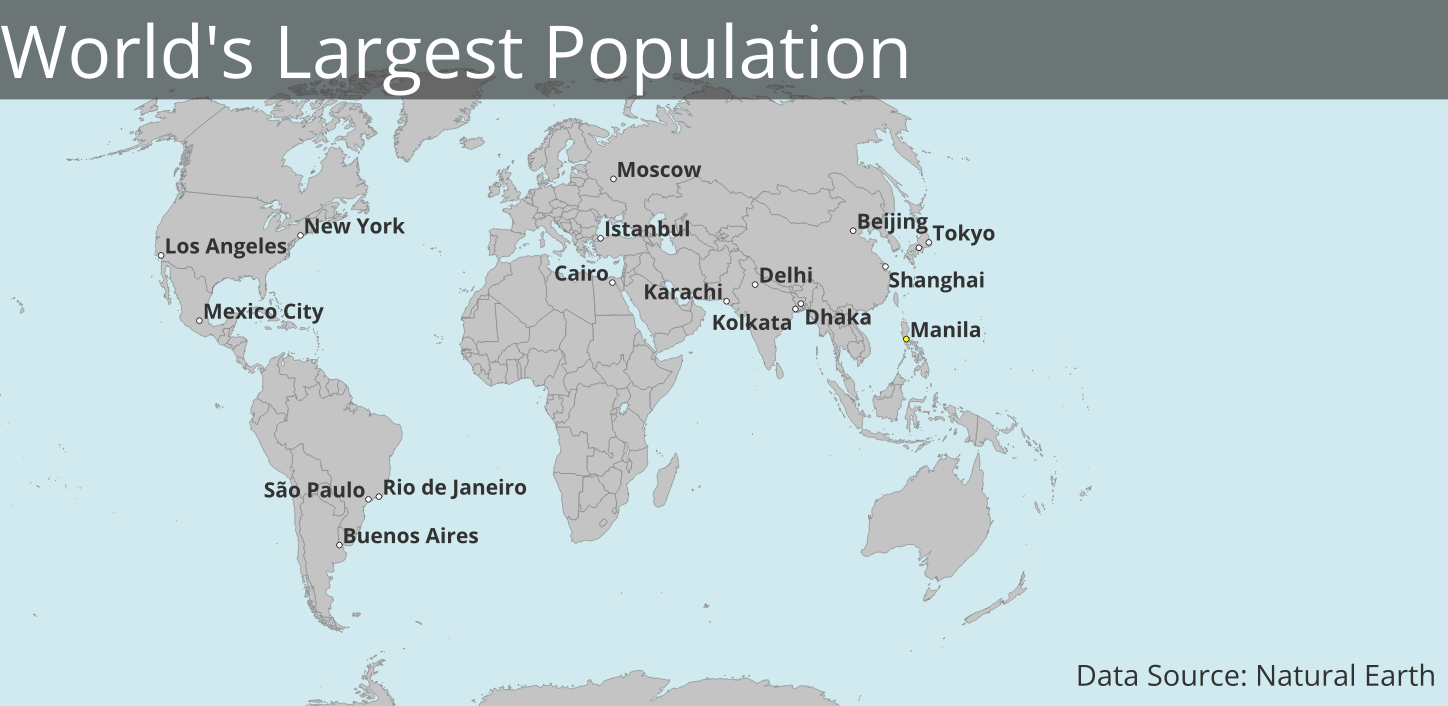
The output of the maps can be shown here.
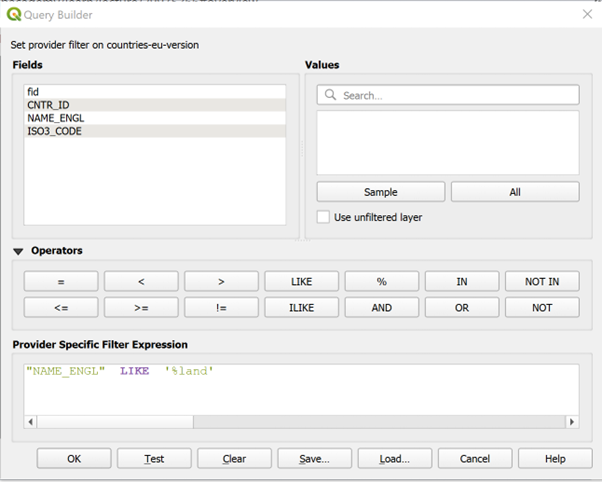
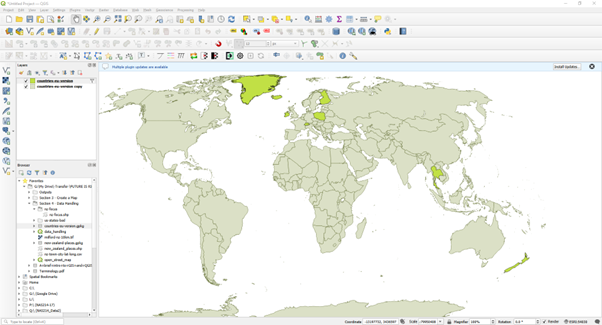
3. Data Handling in QGIS
In the data handling section, we learn more about basic vector and raster data, map projections, several ways of adding data to QGIS, sources where we can find data for GIS, utilizing OpenStreetMap located in the browser panel, and joining a spreadsheet to a map layer.
Here is one of the maps we can create by utilizing OpenStreetMap, filtering data using specific filter expressions, and creating a separate layer.
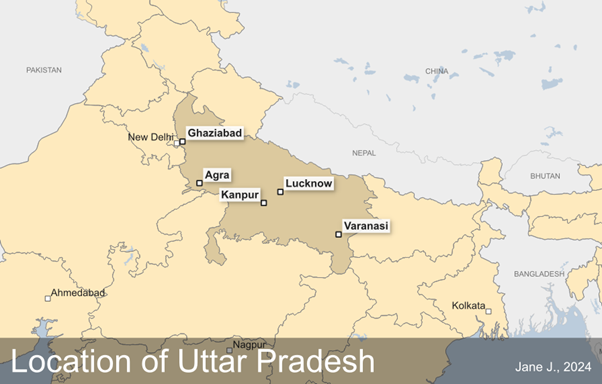
4. Locator Maps
In the locator maps section, we delve deeper into styling beautiful maps for audiences. We explore adding title text, exporting maps to various formats, and a basic overview of utilizing the print layout. The instructor provides an overview article as a reference before creating a locator map. The article can be found here: bbc.com.
Here is a locator map from Uttar Pradesh, India. We can create this map using OpenStreetMap as our base map and then apply filters as needed.
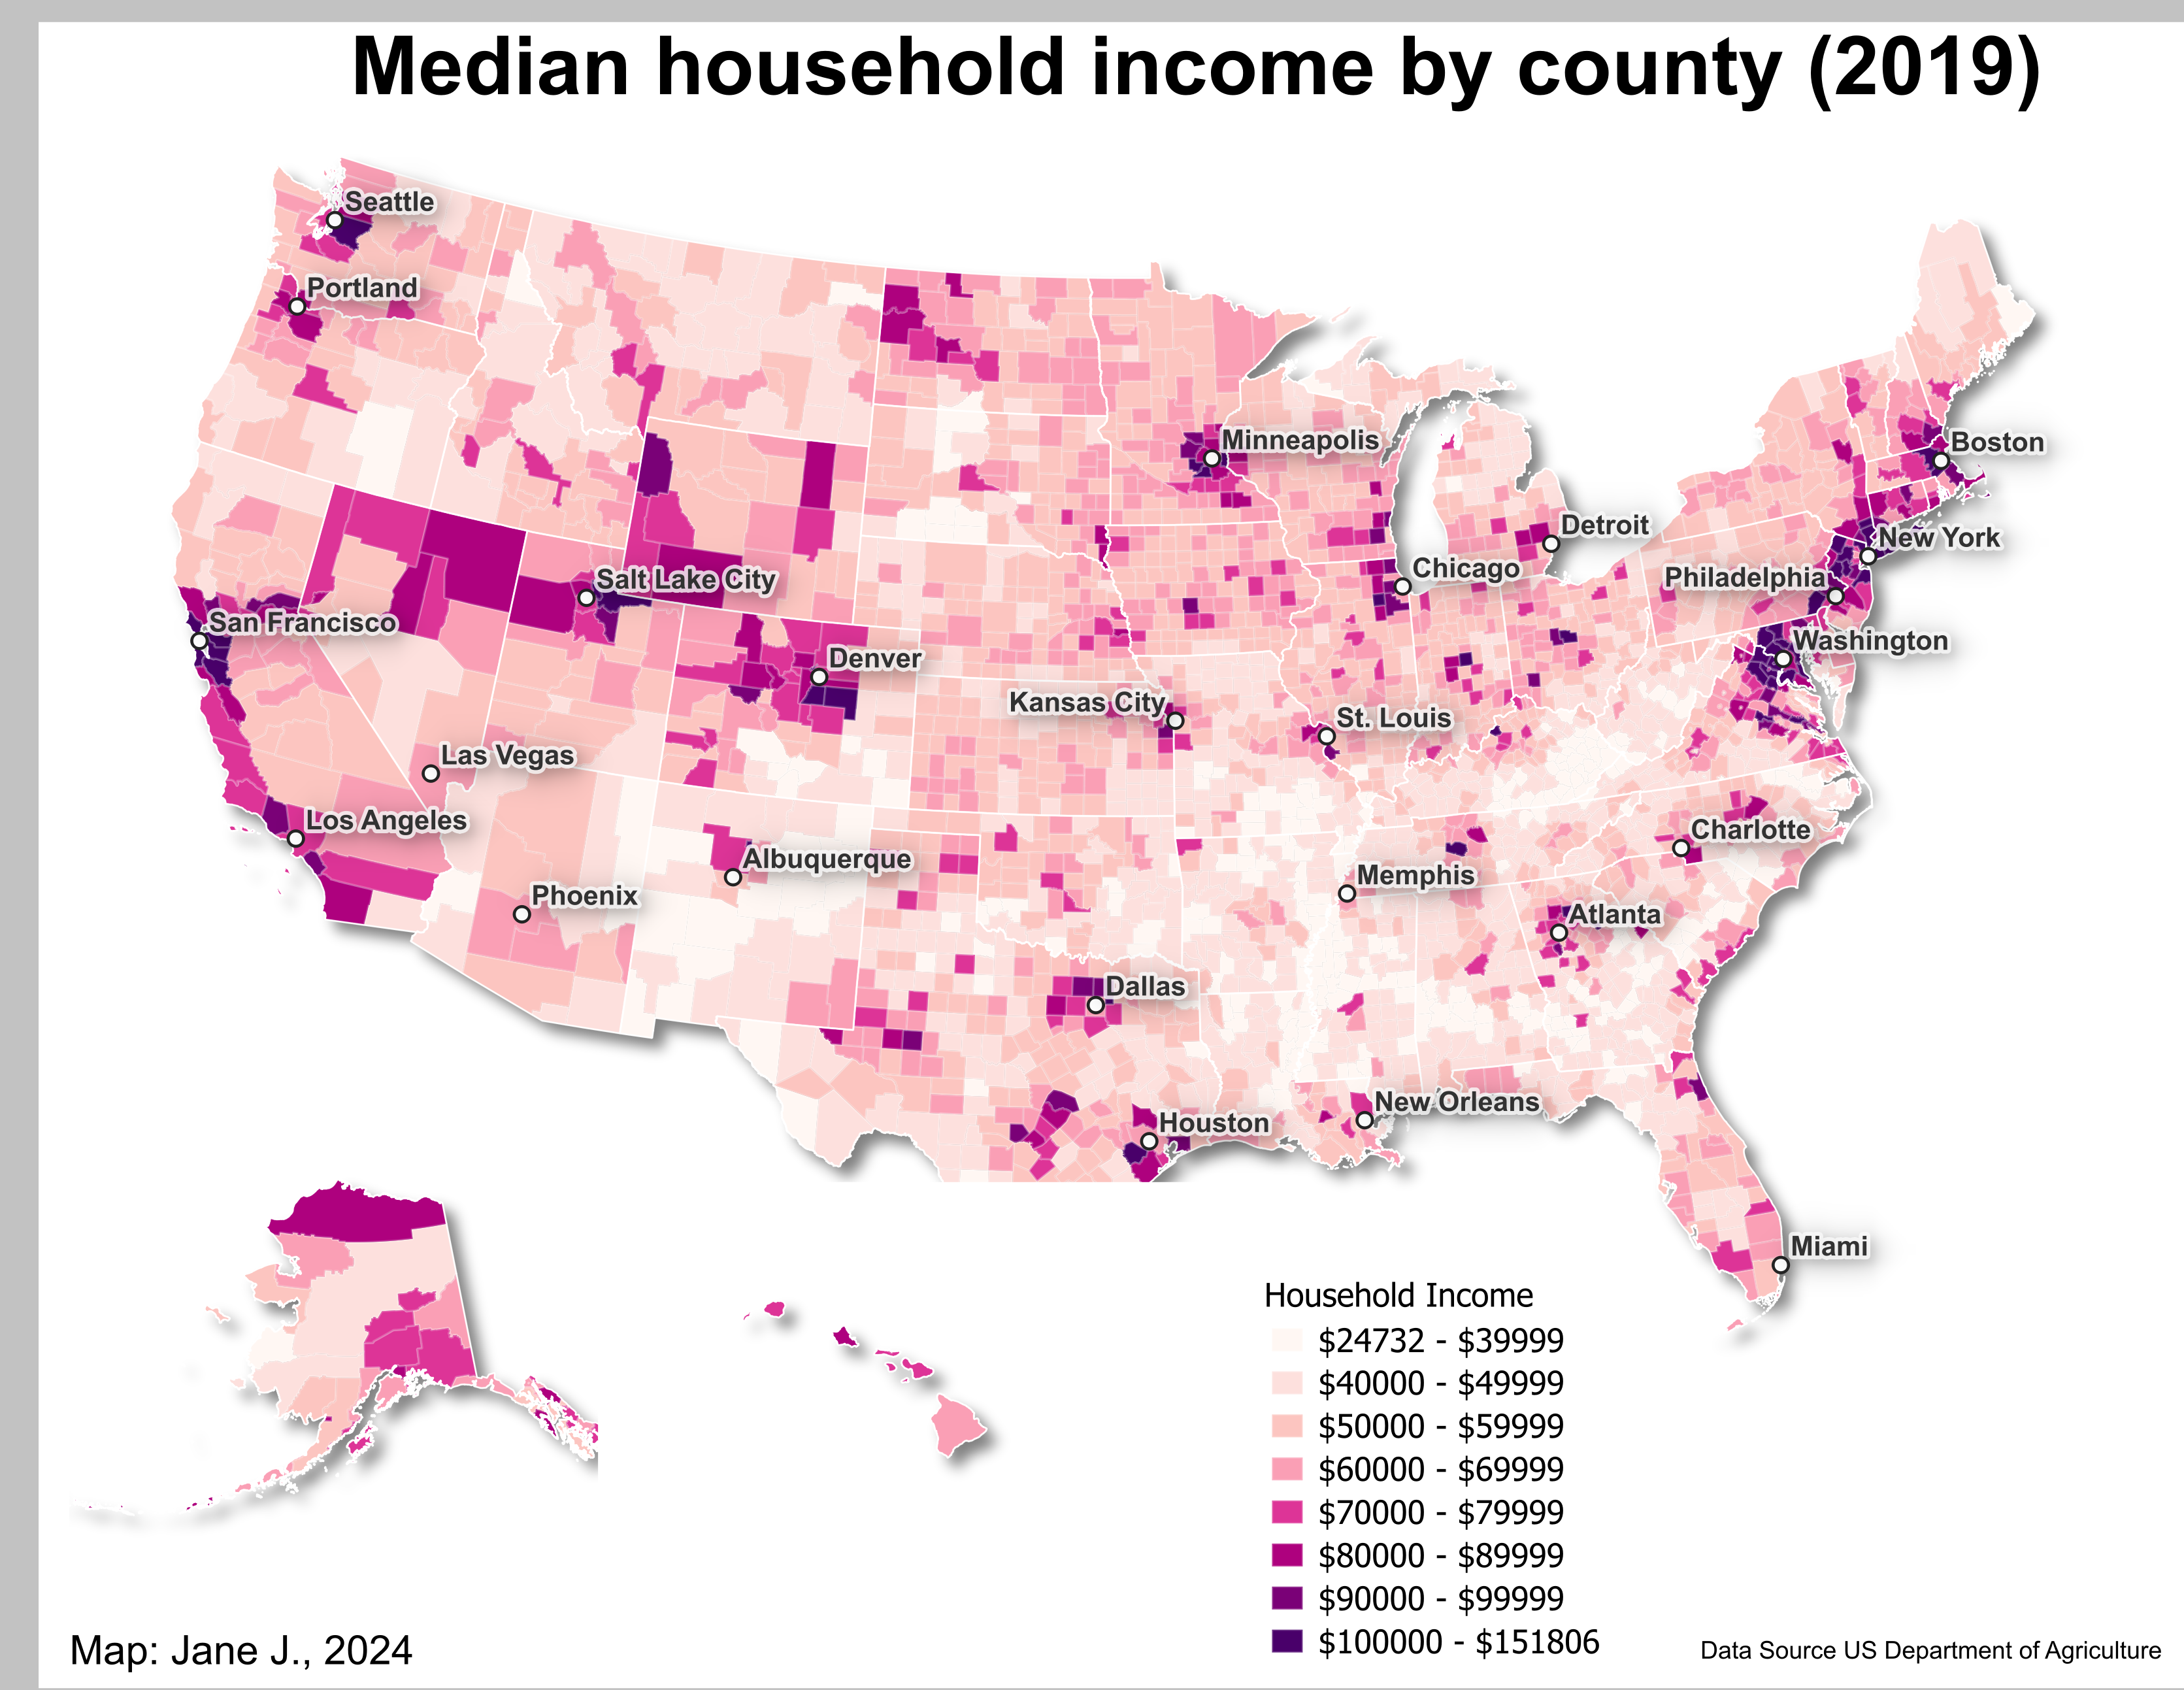
5. Heat Maps/ Choropleth Maps
In this section, we delve deeper into joining datasets and saving them to a layer, adjusting data classes, creating a map using the print layout, and exploring printout ideas.
Here is a heat map of the median income in the US in 2019.
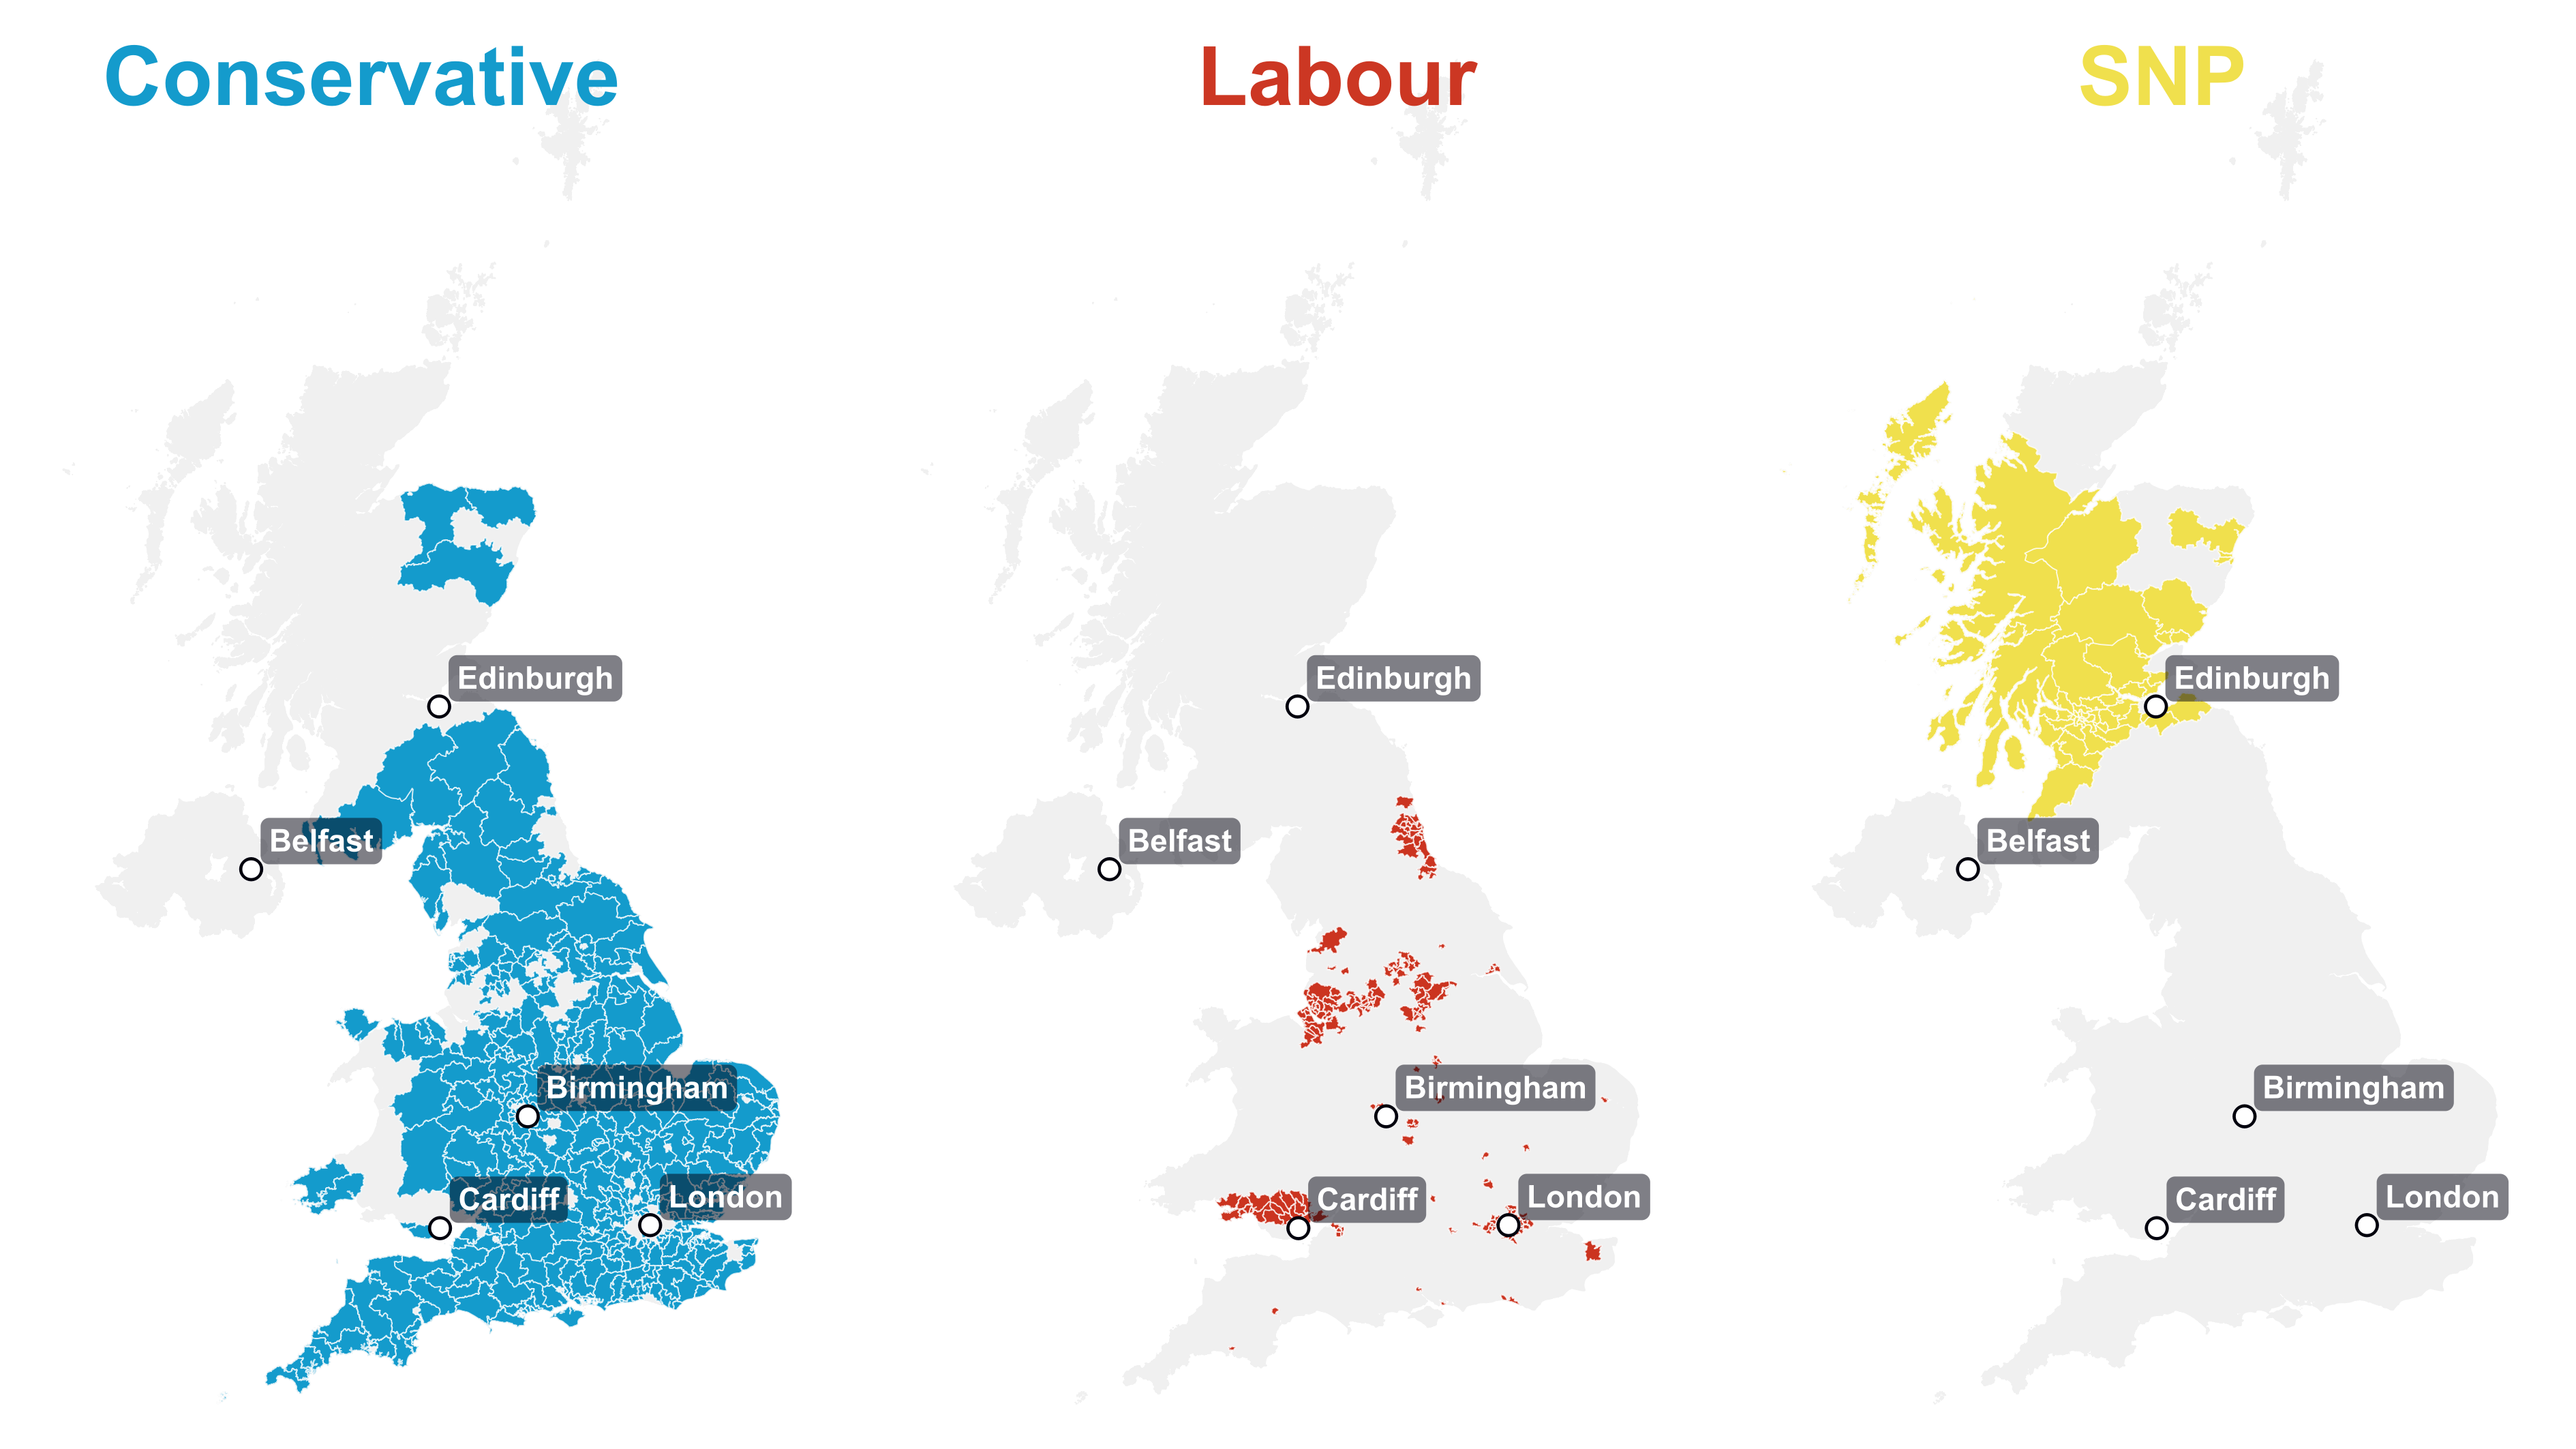
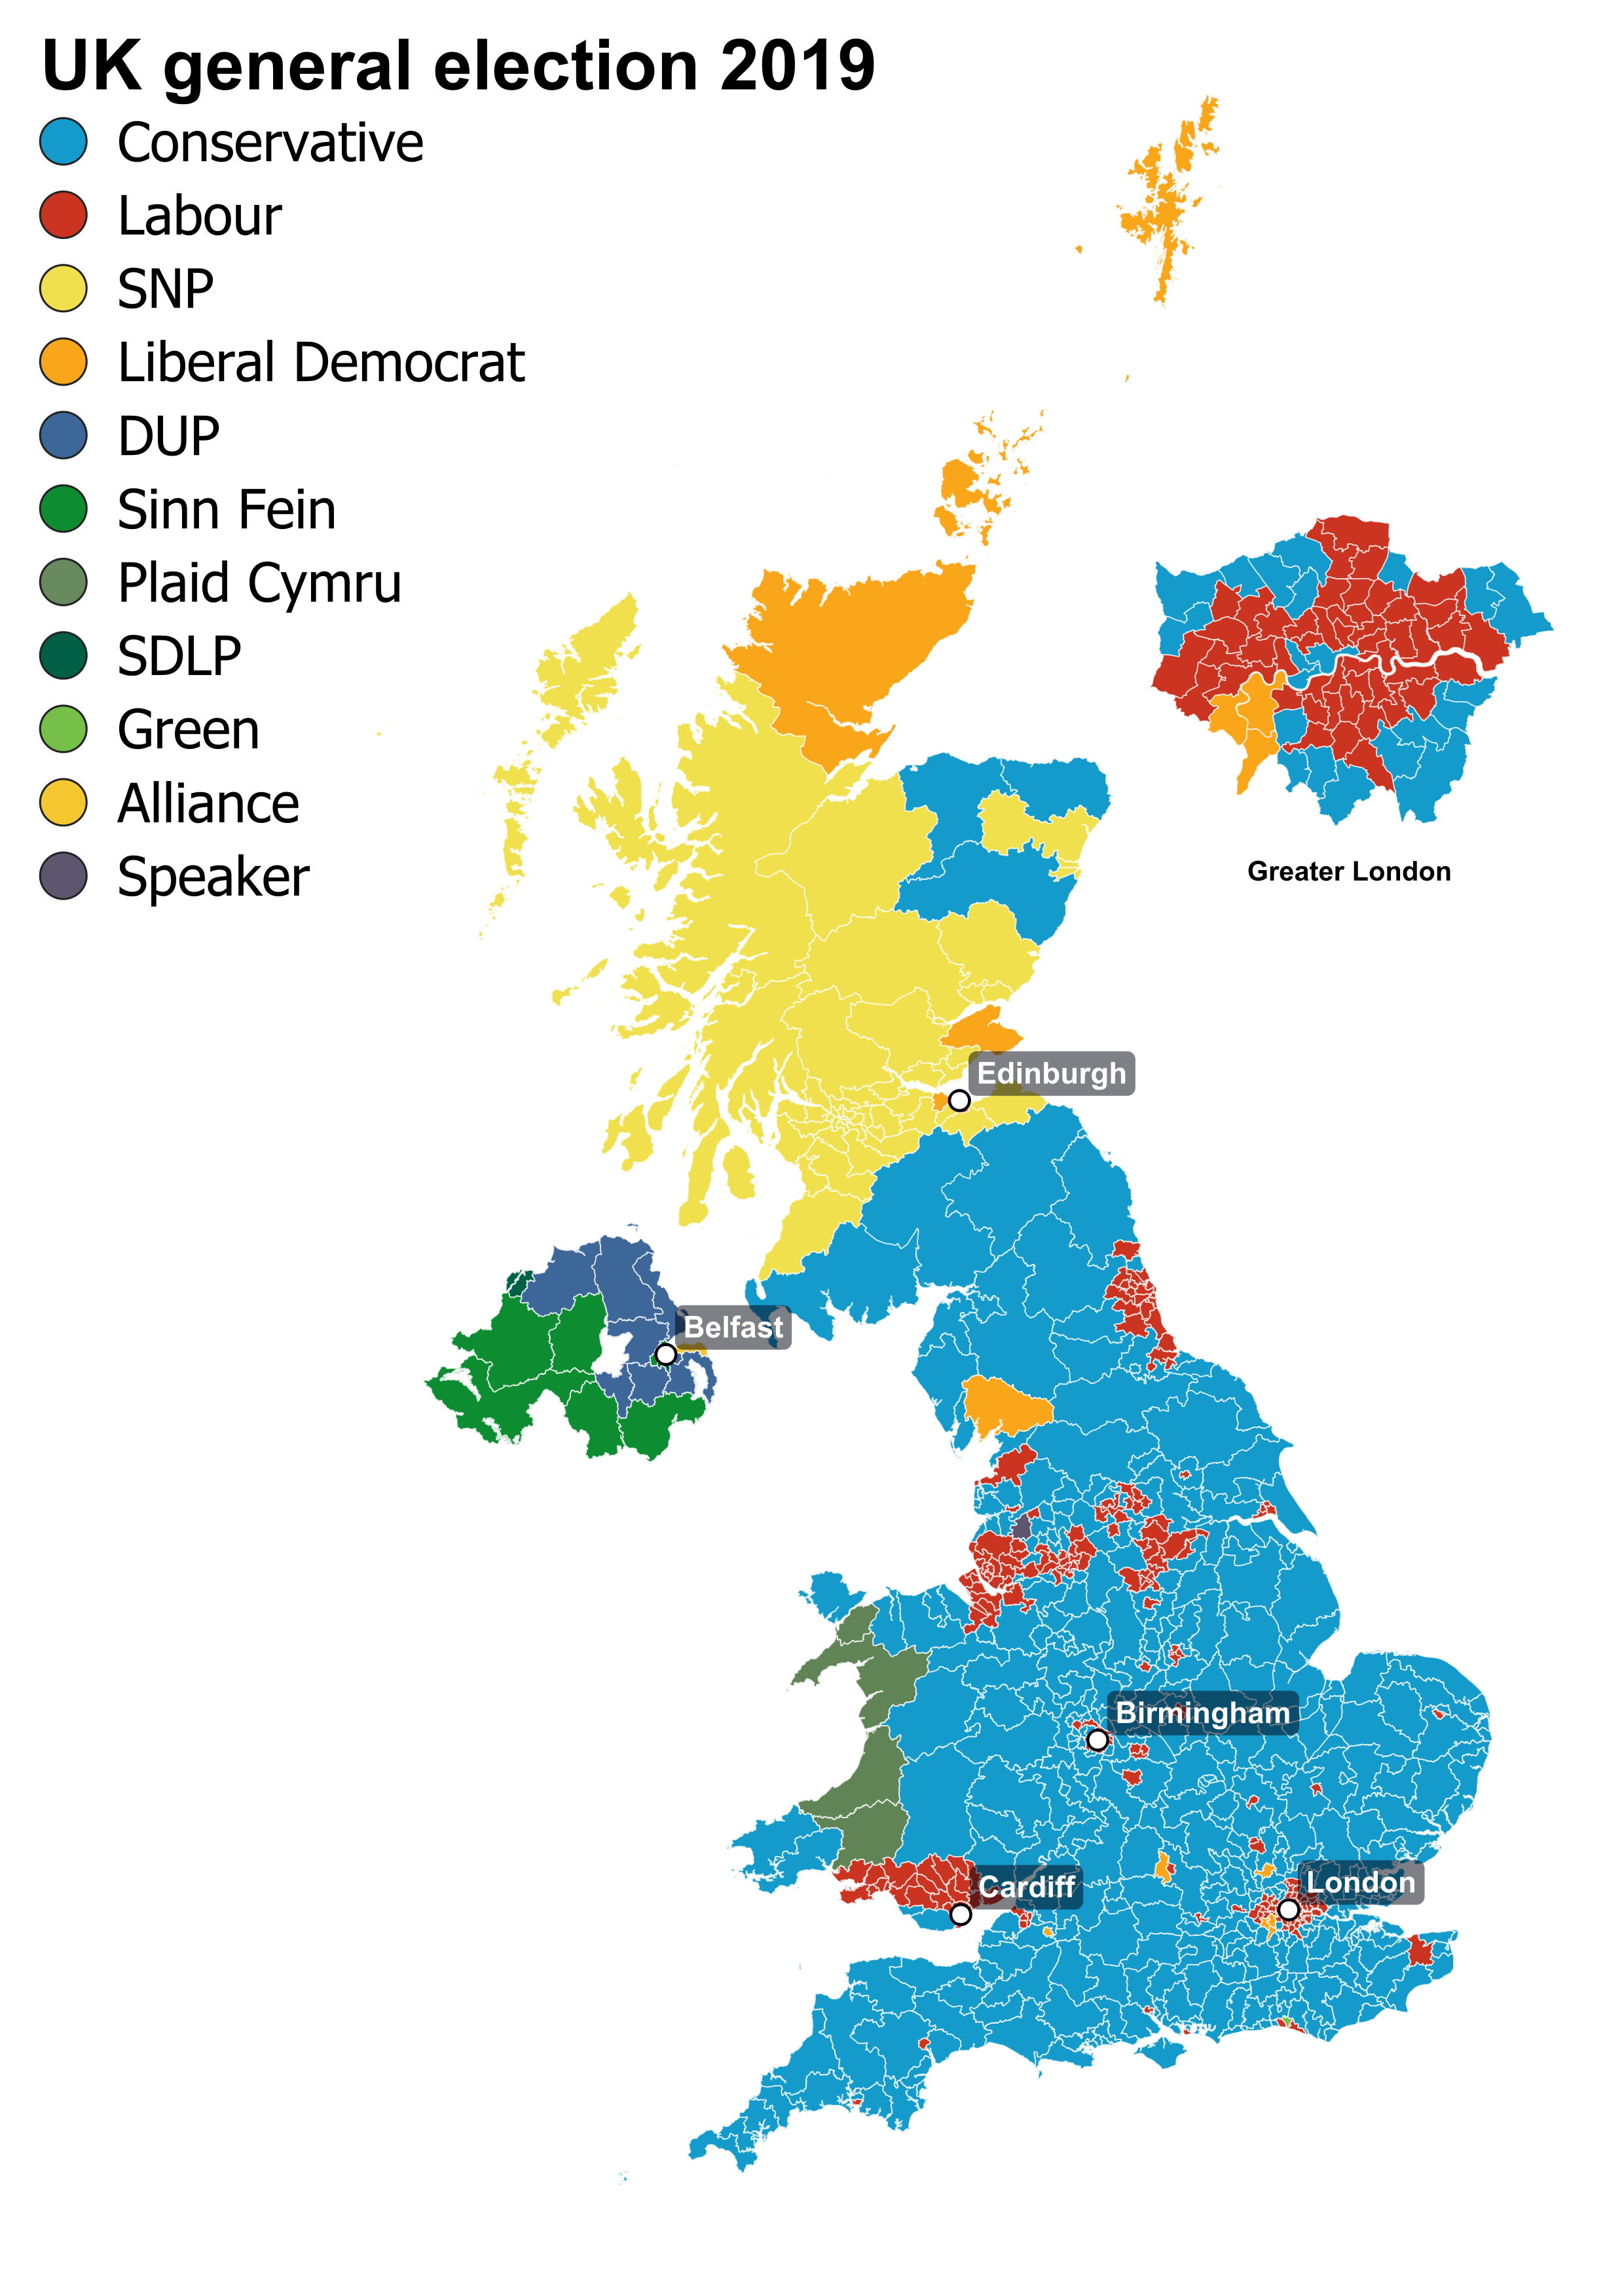
5. Election Maps
In this section, we learn about styling a different type of map: UK election map 2019. We also learn how to add a small inset map and small multiple maps.
Here is some election maps of the UK in 2019.
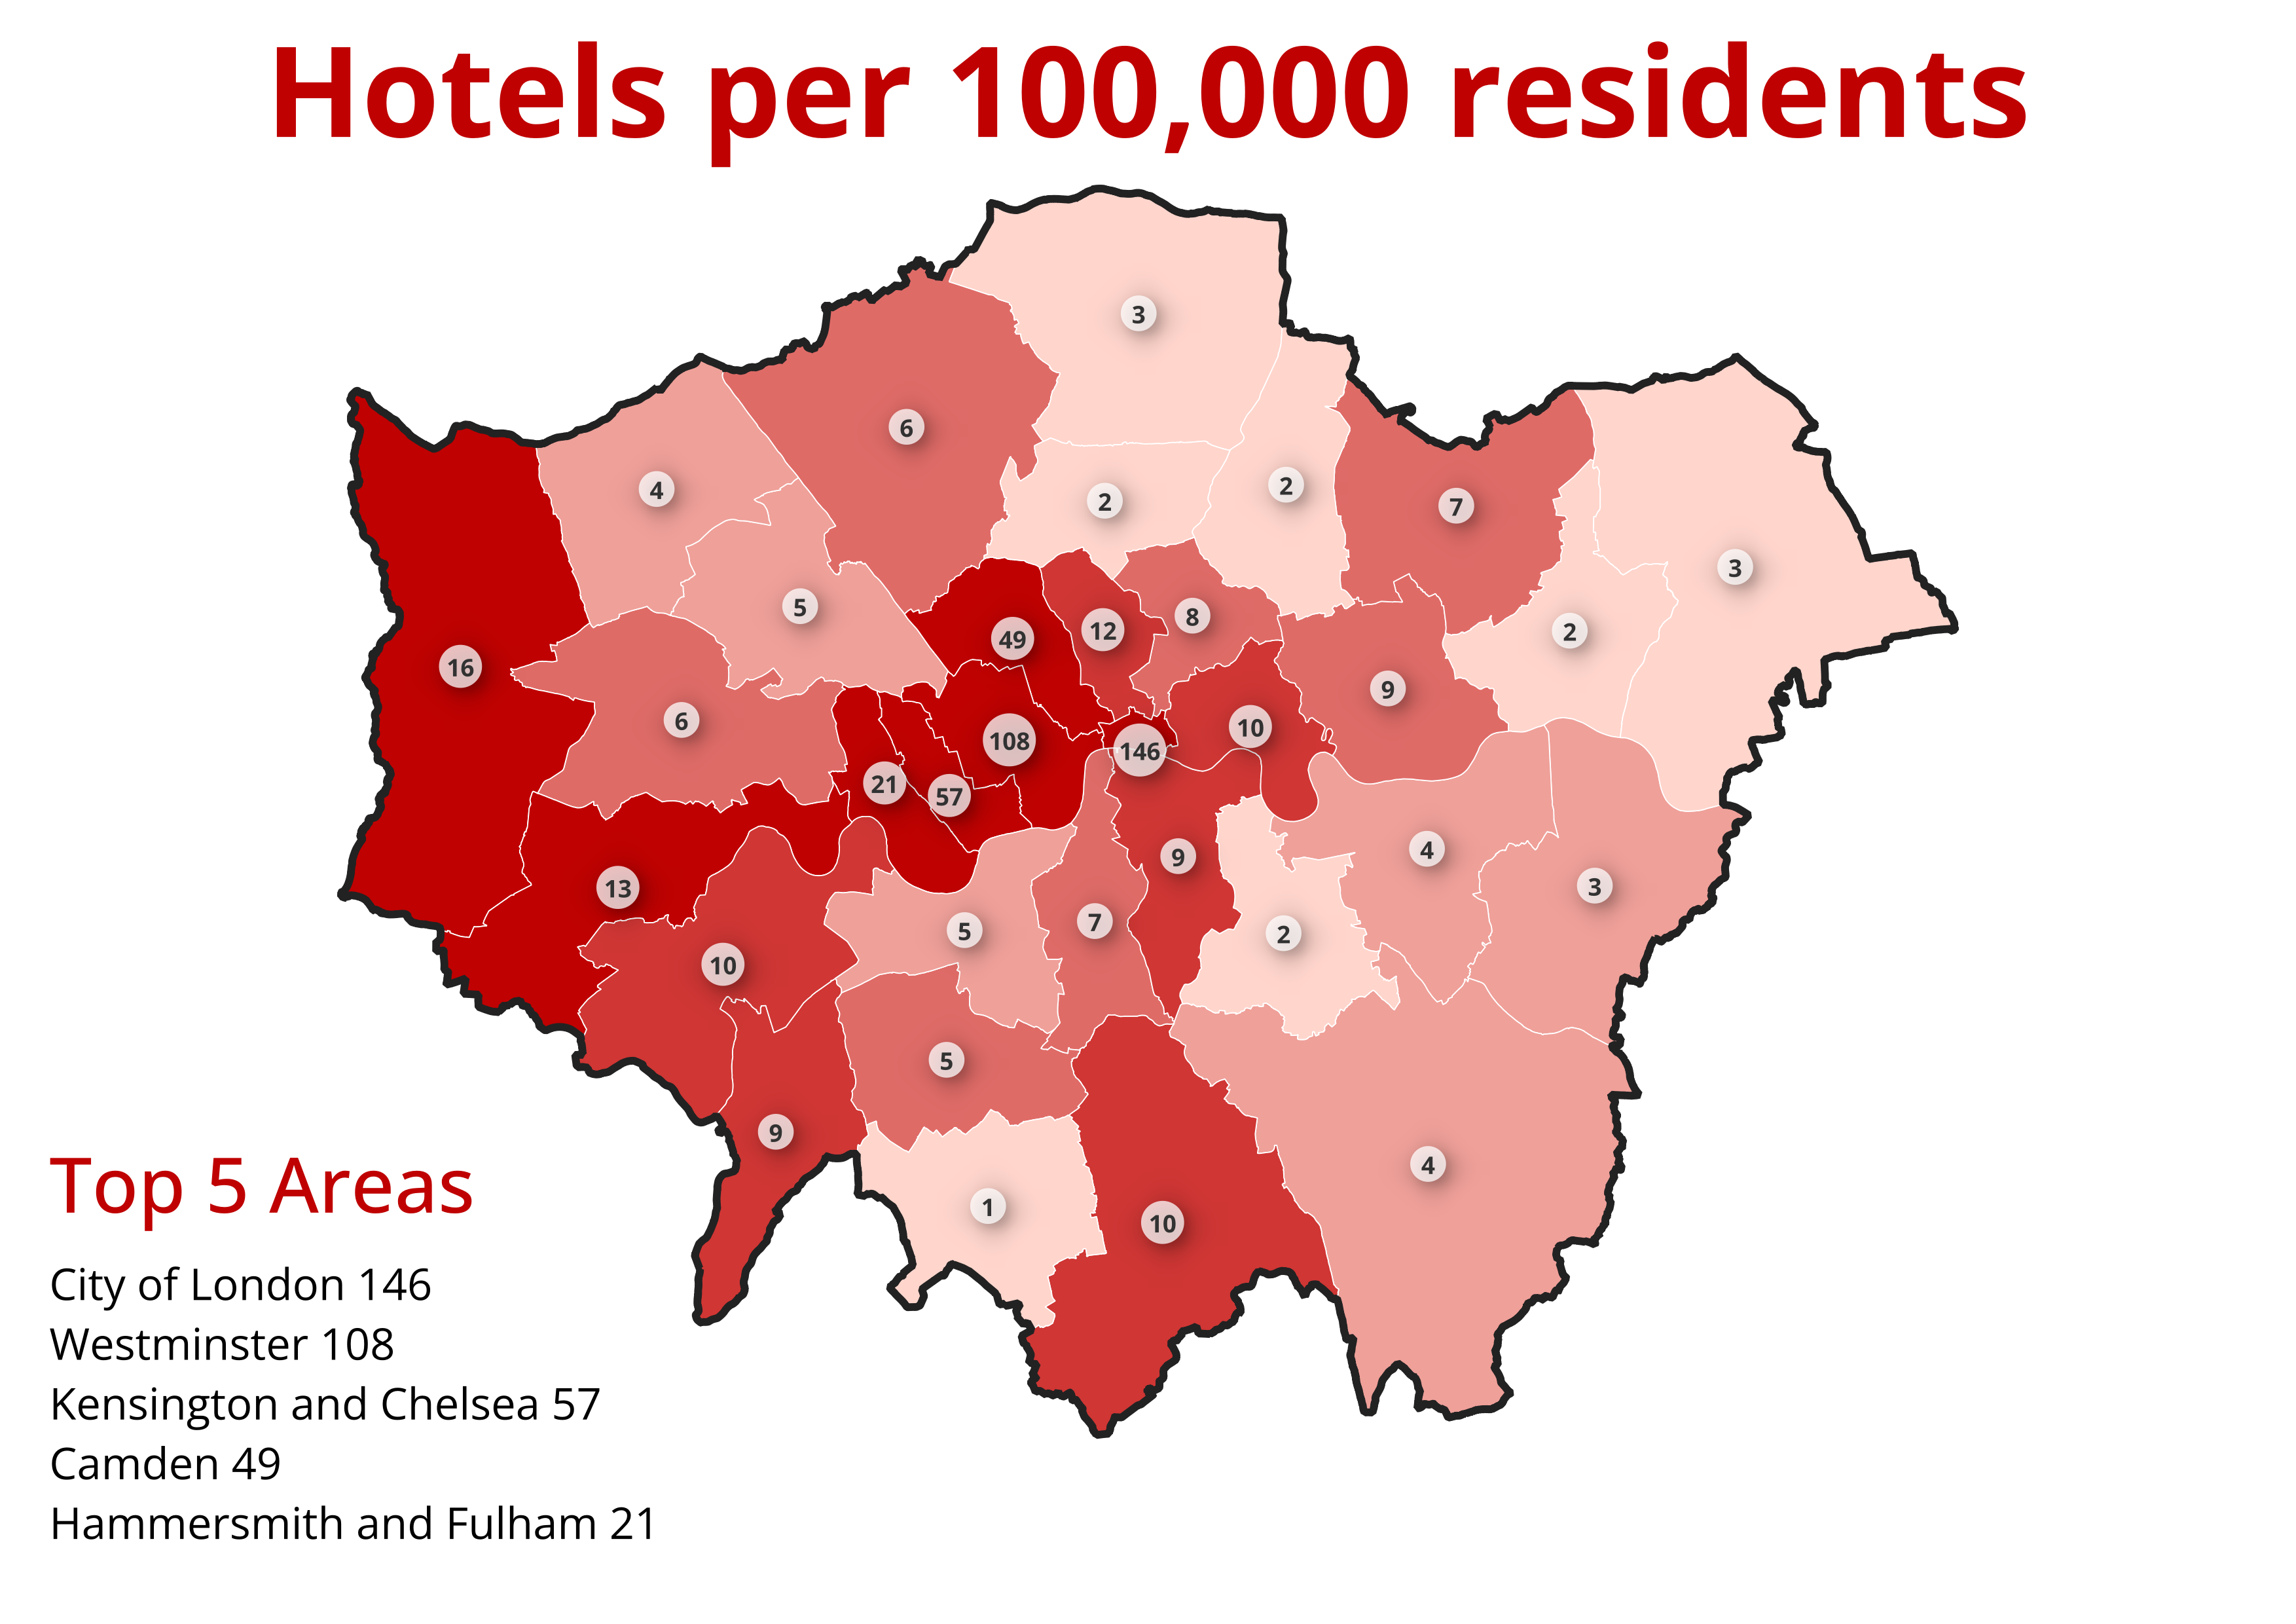
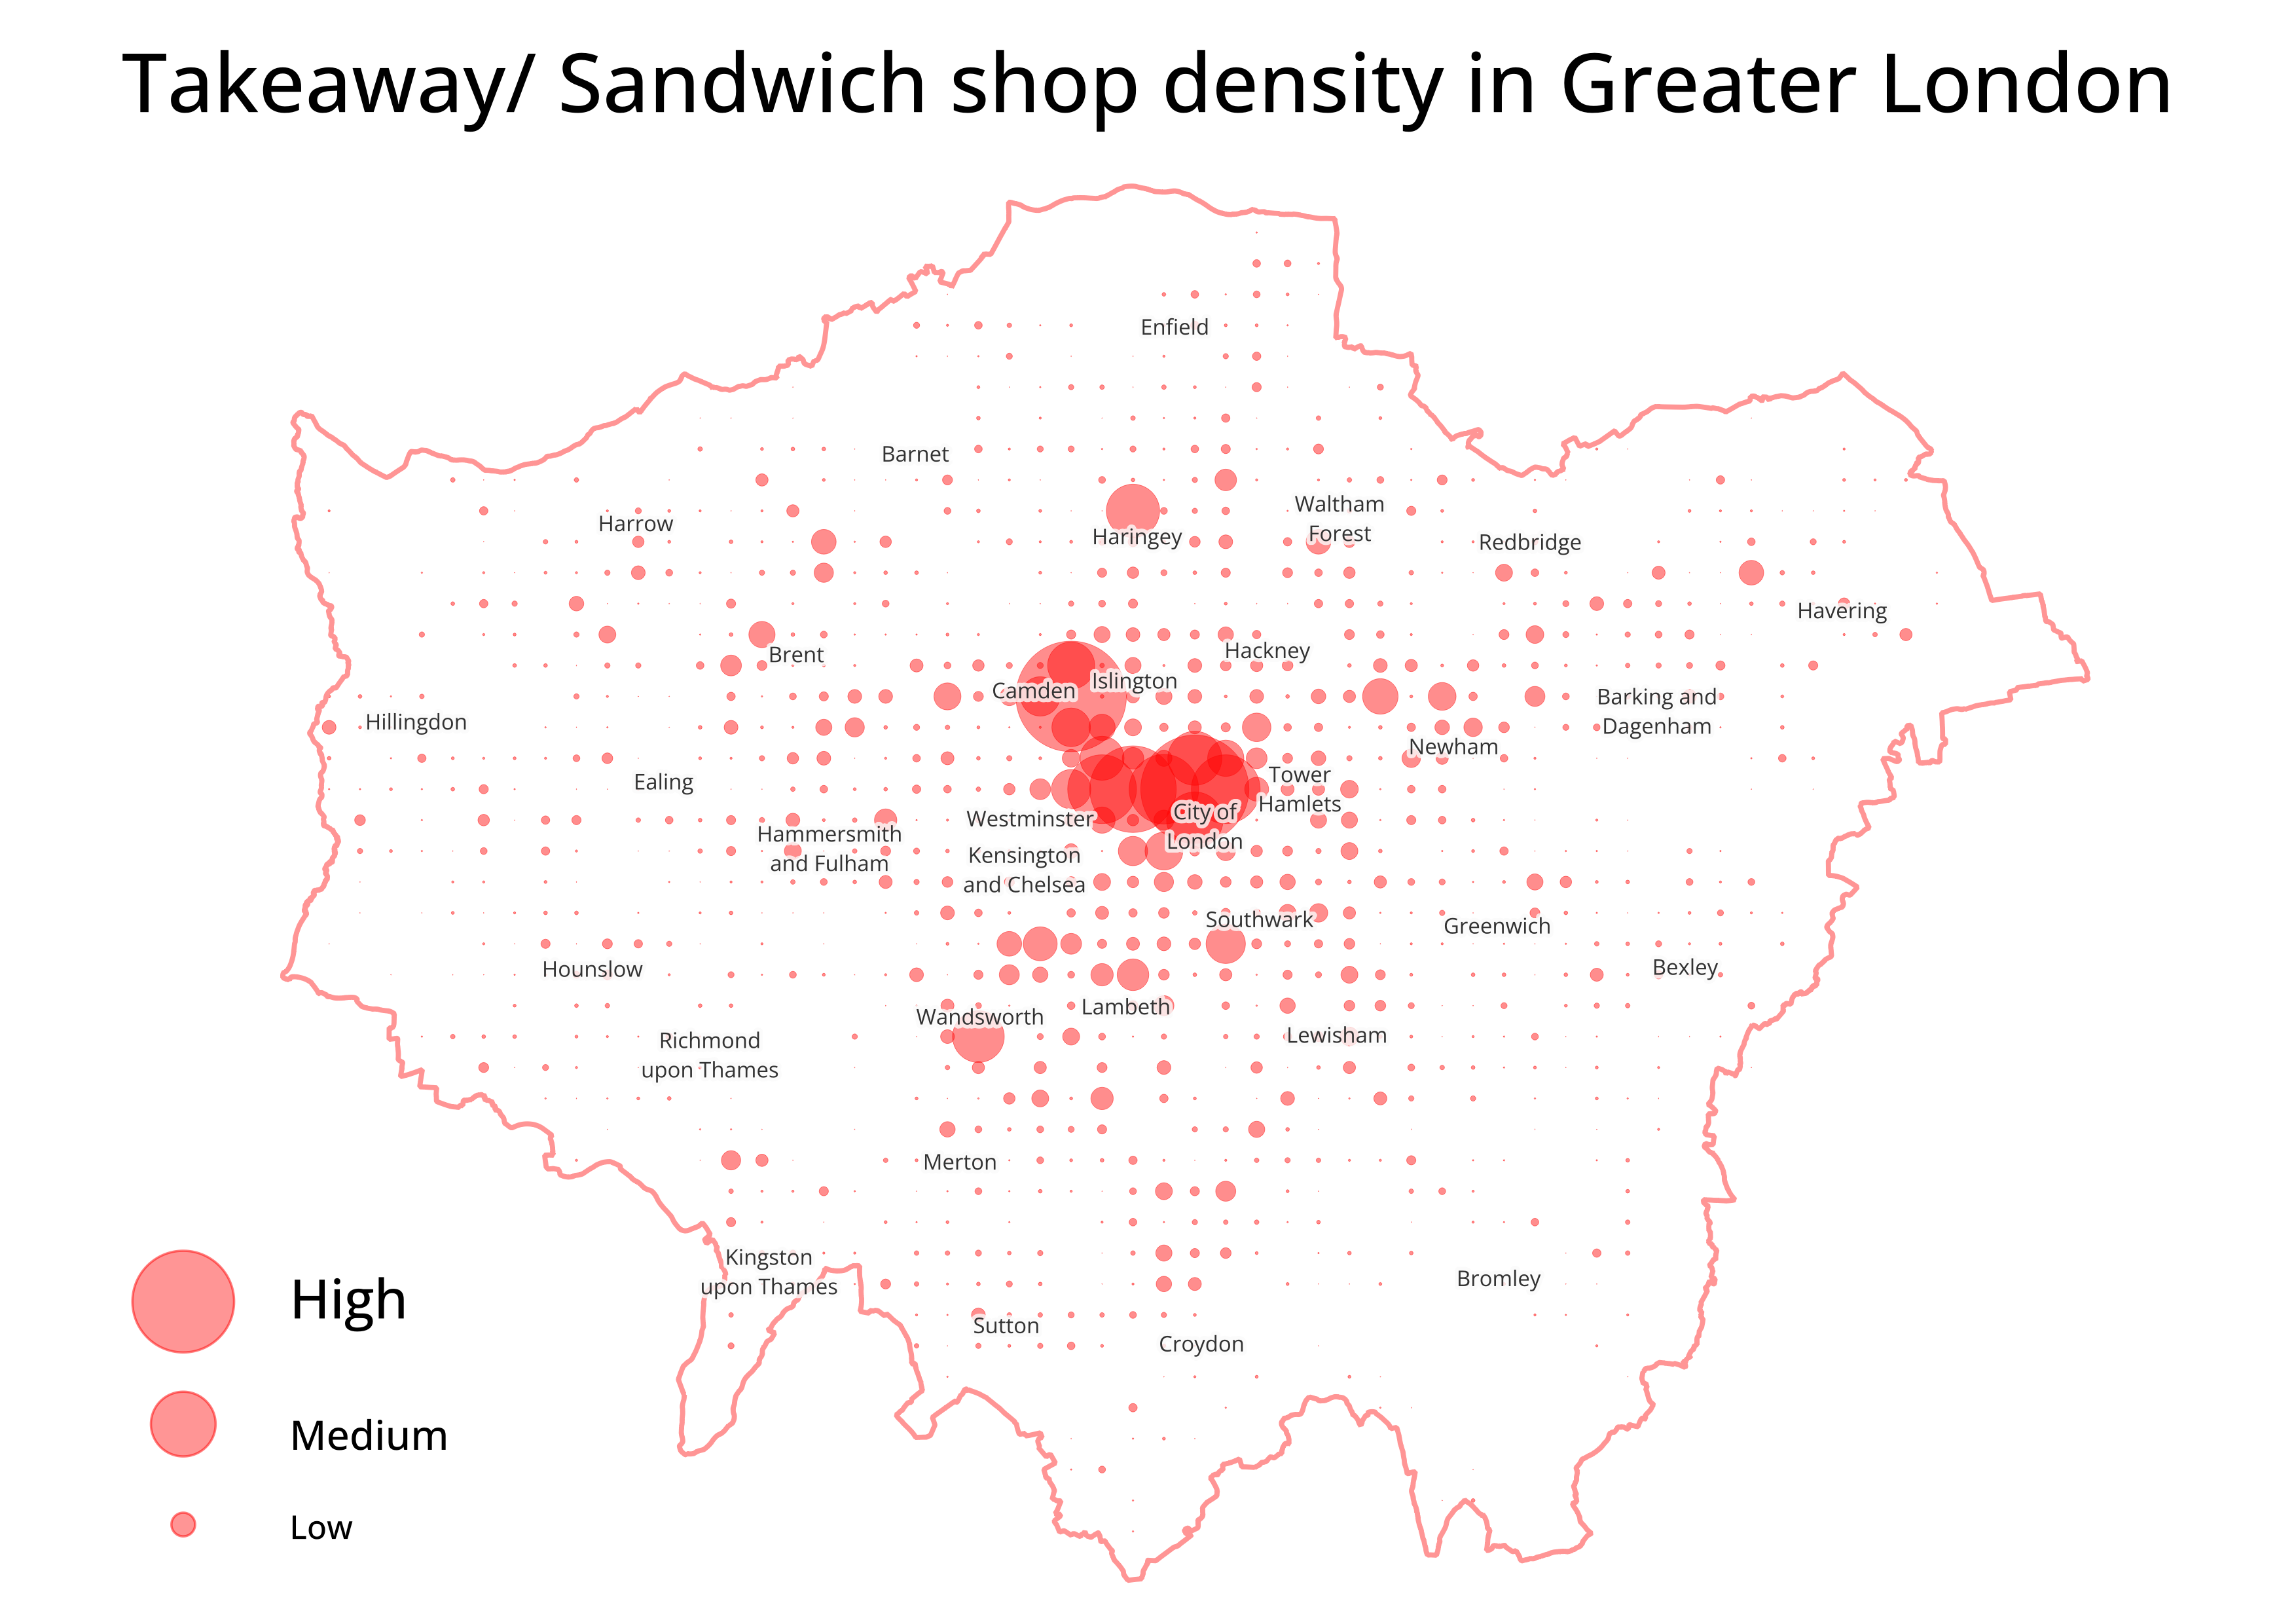
6. Density Maps
In this section, we learn about using heatmap style in QGIS, count points in polygons, and create some density maps.
Here is some density maps of hotels per 100,000 residents and sandwich shop in London.
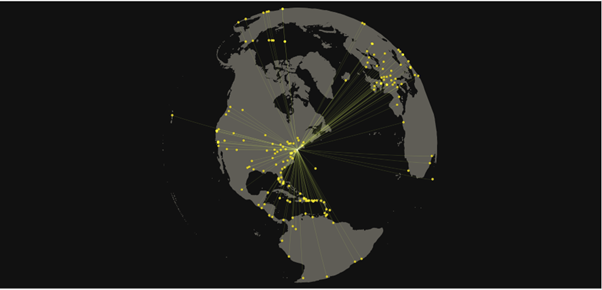
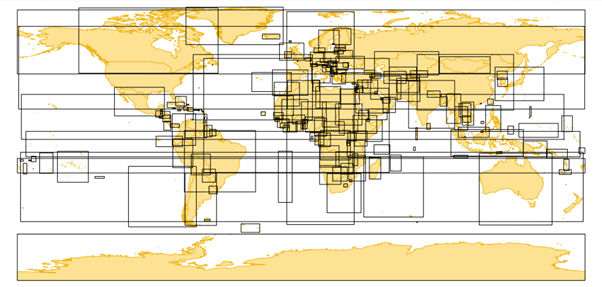
7. Fun Maps
The course taught us how to create some fun maps, including flight routes from John F. Kennedy International Airport and the bounding boxes of each country in the world.
8. Others
The other sections that I haven’t mentioned in this article cover QGIS plugins and some tips and tricks for using QGIS. This course is great for beginners and highly recommended for anyone who wants to start creating maps for spatial analysis right away. The course also provides external materials where you can find data resources.
Journal Reference
- Rae, A. (n.d.). Map Academy: get mapping quickly, with QGIS. Retrieved from Udemy.